Abstract
Objectives
Noninvasive objective tests are needed to diagnose primary Sjogren’s syndrome (pSS) and to evaluate treatment responses. Ultrasound imaging of the salivary glands is rapid and noninvasive. Recent open-label studies suggested that anti-CD20 (rituximab) may be effective in pSS. The purpose of this study was to look for ultrasound evidence of the effects of rituximab in pSS.
Methods
We compared 16 patients fulfilling the new American-European consensus group criteria for pSS to 9 controls, using B-mode ultrasound features (parenchymal homogeneity and gland size) and Doppler waveform analysis of the transverse facial artery of parotid glands. We compared the same parameters in the patients before and after 12 weeks of intravenous rituximab therapy.
Results
Compared to controls, untreated patients had significant abnormalities in salivary gland structure (p < 0.0001) and parotid size (2.05 ± 0.33 cm versus 1.70 ± 0.28 cm; p = 0.001). Doppler waveform analysis showed significant differences before, but not after, lemon stimulation between untreated patients and controls. After rituximab treatment, significant size reductions were noted in the parotids (2.05 ± 0.3 cm at baseline and 1.86 ± 0.27 cm at week 12; p = 0.002) and submandibular glands (2.02 ± 0.54 cm at baseline and 1.66 ± 0.34 cm at week 12; p = 0.001). Doppler resistive indices after lemon stimulation were significantly increased after rituximab treatment.
Conclusion
Salivary gland measurements and blood inflow responses to salivary stimulation as assessed by ultrasound hold promise as objective noninvasive tools for evaluating rituximab effects in patients with pSS.
Keywords: ultrasonography, primary Sjögren’s syndrome, rituximab
Primary Sjögren’s syndrome (pSS) is a chronic autoimmune disorder characterized by lymphocytic infiltrates in the lachrymal and salivary glands. Dryness of the eyes (keratoconjunctivitis sicca) and mouth (xerostomia) are the main clinical features. Histology shows lymphocytic infiltration and destruction of the affected glands.
Sjögren’s syndrome is considered primary in patients who have no underlying connective tissue disease. Investigations must be performed to document the ocular and oral dryness; to rule out connective tissue disease; and to confirm that the dryness is not due to other conditions such as diabetes mellitus, hypovolemia, sarcoidosis, infection, respiratory or renal insufficiency, smoking, or medications. These investigations include salivary flow measurement, sialochemistry, sequential salivary scintigraphy, and sialography using liposoluble or hydrosoluble contrast material. Histological examination of minor salivary gland biopsies may be the most specific investigation for diagnosing pSS.
In recent years, ultrasonography has been described as a simple noninvasive tool for identifying salivary gland changes in patients with pSS (Bradus et al 1988; Kawamura et al 1990; De Vita et al 1992; Ariji et al 1996; Yoshiura et al 1997; Mandel and Orchowski 1998; Makula 2000; Salaffi et al 2000; Yousem et al 2000; Howlett 2003; Gritzmann 2003), although the data are somewhat conflicting. Doppler waveform analysis was found useful for detecting blood flow abnormalities in the sub-mandibular glands of patients with pSS compared to controls (Chikui et al 2000). Resistive and pulsatility indices of the facial artery were decreased in the patients, and responses to lemon stimulation were less marked than in the controls (Chikui et al 2000). Another study (Carotti et al 2001) evaluated blood inflow through the facial artery to the submandibular glands and through the external carotid artery to the parotids but failed to evaluate the transverse facial artery, which contributes to supply the parotid glands. Given the importance of parotid gland involvement in pSS, we believe that the transverse facial artery should be evaluated routinely.
Until recently, the only treatments available for pSS were symptomatic agents designed to relieve the symptoms of dryness. These agents had no effect on the course of the disease. A case-report describing improvement of Sjögren’s syndrome after rituximab therapy for marginal zone lymphoma was published in 2003 (Somer et al 2003). Since then, three open-label studies have suggested that rituximab may be effective in pSS (Pijpe et al 2005; Seror et al 2007; Devauchelle-Pensec 2007). To further investigate the effects of rituximab and other biologics in pSS, tools capable of evaluating salivary gland size, structure, and function are needed.
The objective of this study was to evaluate the ability of ultrasonography and Doppler waveform analysis to detect changes induced by rituximab therapy in patients with pSS. To this end, we measured parenchymal homogeneity, echogenicity, and size; as well as blood inflow through the transverse facial artery before and after lemon stimulation. These parameters were recorded once in controls and twice, before and after rituximab therapy, in patients with pSS.
Materials and methods
Study participants
Patients
We recruited patients seen for pSS between April and December 2004 at the rheumatology and internal medicine departments of the Brest Teaching Hospital. Patients were eligible if they met the new American–European Consensus Group criteria for pSS (Vitali et al 2002) and had active disease defined as scores greater than 50 mm on two of four 100-mm visual analog scales (VAS) that evaluated global disease activity, pain, sicca syndrome, and fatigue, respectively. Patients were excluded if they had secondary Sjögren’s syndrome or presence of any marker for autoimmune disease other than pSS. All histological specimens were examined by the same pathologist (IQR), who determined the Chisholm score (grades 1 to 4) (Chisholm and Mason 1968).
Controls
Because salivary gland abnormalities may differ across patients with pSS according to disease duration and to the balance between lymphocyte infiltration and tissue destruction, we enrolled 9 healthy volunteers as a control group. The controls had a normal medical history, with no symptoms of xerostomia or keratoconjunctivitis sicca; their physical findings were normal and they were not using medications.
Rituximab treatment (patients only)
All patients received 375 mg/m2 of rituximab by intravenous infusion twice at a 1-week interval. The infusion rate was increased from 50 mg/hour initially, in steps of 50 mg/hour every 30 minutes, to a maximum of 400 mg/hour if well tolerated. Hypersensitivity or infusion-related reactions were recorded every 30 minutes. No corticosteroids or immunosuppressants were used concomitantly.
Ultrasound protocol (patients and controls)
Ultrasonography was performed once in the controls and twice in the patients, before and after the 12-week course of rituximab therapy. Ultrasound images were acquired in the supine position with the neck hyperextended and the head slightly turned to the side opposite the glands being examined. Pulsed Doppler and B-mode ultrasonography studies were performed using an ATL HDI machine (ATL, Boswell) equipped with a linear 12-MHz probe and a 5- to 7-MHz convex probe. The 12-MHz probe was used to determine echostructure and the 5- to 7-MHz probe to measure gland size. Both bilateral parotid and submandibular glands of each patient were scanned in 2 planes, parallel and perpendicular to the submandibular plane. The sonographic images of both parotid and submandibular glands scanned parallel to the sub-mandibular plane were used for the analysis. Axial and coronal views of the parotid and submandibular glands were obtained. The transverse facial artery, which supplies the parotid gland, was examined. All ultrasound parameters were evaluated by the same ultrasonographist (SJJ) (who do not have the patient characteristics) to eliminate interobserver variability.
The normal parotid is homogeneous by ultrasonography. Echogenicity is similar to that of the thyroid gland and greater than that of the masseter. We used a previously reported ultrasound grading procedure (De Vita et al 1992) based on parenchymal homogeneity, echogenicity, gland size, and posterior glandular border: Grade 0, normal glands; Grade 1, regular contour, small hypoechogenic areas without echogenic bands, normal or increased gland size (mean 20 ± 3 mm for the parotids and 13± 2 mm for the submandibular glands), and definite echogenic border; Grade 2, regular contour, multiple hypoechogenic areas usually <2 mm without echogenic bands; Grade 3, regular or ill-defined contour, multiple hypoechogenic areas and hyperechogenic bands, and no visible posterior glandular border; Grade 4, irregular contour, multiple hypoechogenic areas >6 mm or multiple calcifications with echogenic bands, decreased gland size, and no visible posterior glandular border. The ultrasound findings were considered abnormal if either parotid or sub-mandibular glands were Grade 1 or higher.
Color Doppler was used to visualize the transverse facial artery (main branch to the parotids) near the auditory canal. Pulse repetition frequency was 700 Hz, and color gain was adjusted dynamically to maximize visualization of the arteries while minimizing noise. Doppler waveforms were recorded, and resistive index and acceleration time were determined. Resistive index was computed as the difference between peak systolic and end-diastolic velocities over the peak systolic velocity. Acceleration time was the time interval from systolic flow onset to the first peak and was recorded in milliseconds. These waveform parameters were determined before and after salivary stimulation with lemon juice. We placed 3 ml of lemon juice extract on the floor of the mouth and asked the patient to wait 10 seconds before swallowing. During these 10 seconds, before swallowing, we recorded the waveform on the left transverse facial artery.
Ethical aspects
The study design was approved by the institutional review board of the Brest Teaching Hospitals. All patients gave their written informed consent.
Statistical analysis
Version 12.0 of the Statistical Package for the Social Sciences software for Windows (SPSS, Chicago, IL) was used. Data are reported as mean ± SD. Data from controls and untreated patients were compared using Mann-Whitney and chi-square tests. To compare data in patients before and after rituximab, we used the Wilcoxon matched-pairs signed-rank test for paired data. P values less than 0.05 were considered significant.
Results
Baseline characteristics of the controls and patients
Nine healthy volunteers (8 females and one male; mean age: 60.2 ± 11.6 years) and 16 patients with pSS (14 females and two males; mean age: 54.9 ± 12.8 years) were included. Tests were positive for antinuclear antibody in all 16 patients, for anti-SSA in 13 patients, and for anti-SSB in 7 patients. Their characteristics have been previously published (Devauchelle-Pensec et al 2007). All patients had an ultrasound evaluation at inclusion; 14 of the 16 treated patients had an ultrasound evaluation at all visits.
Comparison between patients and controls
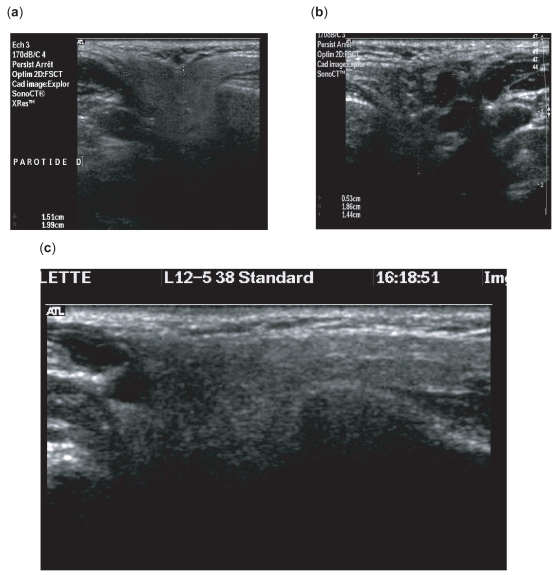
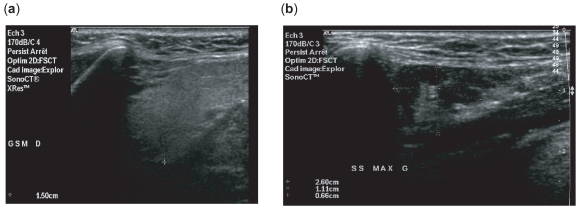
Parotid size and ultrasound grade were significantly different between the patients and controls (Table 1 and Figures 1 and 2).
Table 1.
Baseline characteristics of salivary glands of 16 patients with primary Sjögren’s syndrome (before treatment) and 9 healthy controls
| Salivary glands | N = 18 (9 healthy controls) | N = 32 (16 patients) | p value |
|---|---|---|---|
| Size of parotid glands (cm) | 1.7 ± 0.28 | 2.05 ± 0.33 | 0.001 |
| Size of submandibular glands | 1.81 ± 0.30 | 2.02 ± 0.54 | 0.9 |
| Sonographic grade (B mode) | |||
| 0 | 18 (100%) | 8 (25%) | |
| ≥1 | 0 | 24 (75%) | <0.0001 |
| Grade among group ≥1 | |||
| 1 | 0 | 7 (22%) | |
| 2 | 0 | 10 (31%) | |
| 3 | 0 | 6 (19%) | |
| 4 | 0 | 1 (3%) | |
Figure 1.
High-resolution, 10 MHz, axial sonograms of parotid gland. Parenchymal pattern of the parotid gland in control (a) and patients (b, c).
Figure 2.
B-mode image of submandibular gland. (a) Homogenous parenchyma. (b) heterogenous parenchyma.
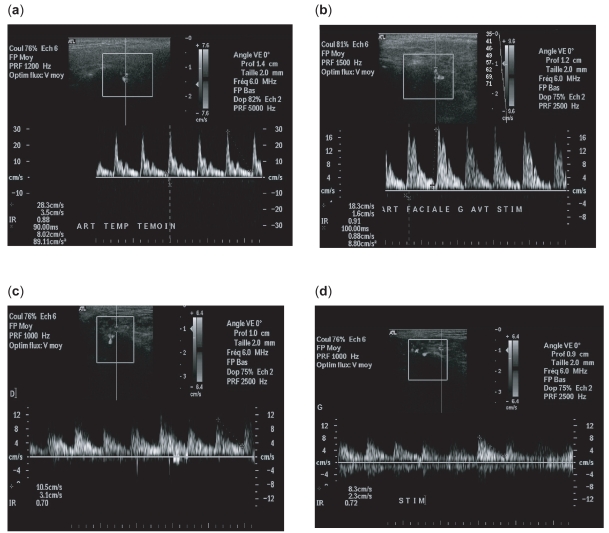
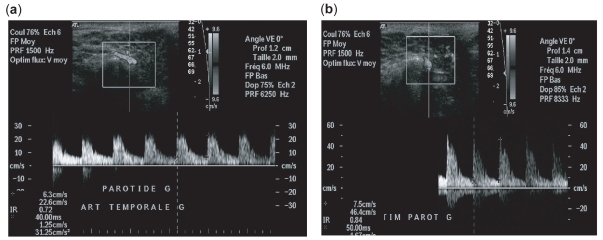
Blood flow in the controls was characterized by a high systolic peak and a prominent second peak of compliance, followed by low diastolic flow (Figure 3a). In the patients, flow was more uniform than in the controls, with blunted systolic and compliance peaks followed by a higher diastolic flow (Figure 4a). Lemon stimulation was followed by increases in the compliance peak and diastolic flow in the controls (Figure 3b), whereas in the patients diastolic flow was similarly high before and after stimulation (Figure 3c, d). Thus, lemon stimulation induced no significant changes in the waveform profile of the transverse facial artery in the patients (Figure 4b). Basal resistive index values were significantly lower in the patients than in the controls (0.75 ± 0.05 vs 0.81 ± 0.42; p < 0.005). After lemon stimulation, however, resistive index values were not significantly different between the patients (0.72 ± 0.07) and the controls (0.73 ± 0.42). No significant differences in acceleration time were noted between the patients and controls in the basal state (90 ms vs 65 ms) or after lemon stimulation (82 ms vs 74 ms).
Figure 3.
At baseline. (a) Doppler waveform without lemon stimulation: control population. High systolic peak and a prominent following compliance peak, followed by a low diastolic flow (RI = 0.88). (b) Doppler waveform with lemon stimulation: control population. Physiologic changes in vasculature when parotid gland is stimulated in controls. Level of systolic and diastolic flow is increased (RI = 0.91). (c) Doppler waveform in patient population without stimulation. We noted a decreased impedance in parotid vessels with a decrease RI (RI = 0.77). (d) Doppler waveform with lemon stimulation: patients. The waveform profile is the same before and after stimulation.
Figure 4.
Patient population treated by anti-CD20. (a) Pss patient population without stimulation: the resistive indice is clearly decreased (b) Pss patient population with lemon stimulation: the resistive indice is increased.
Comparison before and after 12 weeks of rituximab treatment in the patients
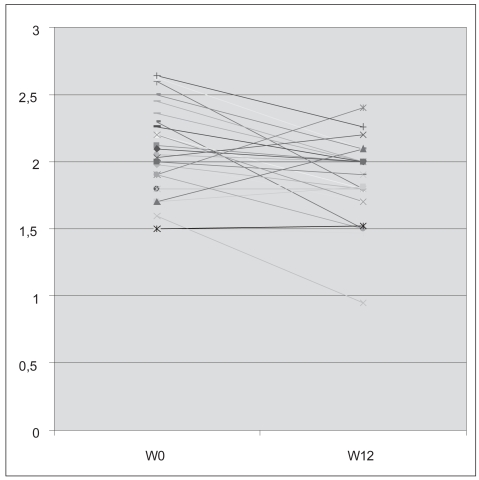
All 16 patients had parotid evaluation (32 parotid glands) and 13 of them had also submandibular evaluation (26 sub-madibular glands). No changes in parenchymal homogeneity or echogenicity were noted after rituximab compared with baseline. However, gland size decreased significantly. Parotid gland size diminished from 2.05 ± 0.3 cm to 1.86 ± 0.27 cm (p = 0.002) (Figure 5) and submandibular gland size from 2.02 ± 0.54 cm to 1.66 ± 0.34 cm (p = 0.001).
Figure 5.
Individual evolution of the parotid size of the patients before (W0) and after (W12) rituximab treatment.
We sought to determine whether the structural changes assessed based on the US grade in the salivary glands correlated with the resistive index. In the 5 patients with Grade 1 or 2 glands, the resistive index was unchanged after lemon stimulation (0.77 ± 0.04 under basal conditions vs. 0.80 ± 0.05 after stimulation). In the 9 patients with grade 3 or 4 glands, the resistive index fell significantly from 0.74 ± 0.05 under basal conditions to 0.71 ± 0.07 after stimulation (p = 0.003).
Under basal conditions, the resistive indices were similar at baseline (0.75 ± 0.05) and after rituximab (0.77 ± 0.1) (p = NS). After lemon stimulation, at W0, no increase in resistive index occurred. In contrast, at W12 after treatment, a significant increase was seen (RI 0.77 ± 0.01 at W0 to 0.79 ± 0.08 at W12) (p < 0.05) with a systolic peak, a compliance peak, and a diastolic flow. Further, stimulation with lemon at week 12 changed the waveform profile of the transverse facial artery and had a normal appearance.
Correlation between rituximab treatment efficacy and sonographic modifications
Clinical and biological results have been previously published (Devauchelle-Pensec et al 2007). At week 12, subjective variables including fatigue and dryness were significantly improved (p < 0.05). Seven patients of 16 at week 24, 7 of 15 at week 32, and 9 of 15 at week 36 improved their 4 VAS scores: global, pain, fatigue, and dryness. In contrast, there were no significant changes in the unstimulated salivary flow rate; the salivary gland focus score; the ophthalmologic evaluation; the titers of ANA, anti-SSA, and anti-SSB; complement levels; CICs and levels of serum IgG and IgA. There was a dramatic reduction in B cells of the blood and the salivary gland (SG) in all cases. We failed to demonstrate any correlation between clinical (VAS), biological (gammaglobulinemia, CD19 depletion) or histological (Chisholm grade) data and glandular size evaluated by ultrasound.
Discussion
The diagnosis of pSS rests on history-taking, physical examination, laboratory tests, salivary gland biopsy, and sialography or salivary gland scintigraphy. However, patients may report symptoms of dryness yet have normal findings from tests for autoimmunity and lip biopsies. Sialography has been widely used to diagnose Sjögren’s syndrome but causes discomfort or pain during the examination. In a recent comparison of magnetic resonance imaging (MRI) and ultrasonography, both techniques showed structural changes in the parotid glands (Makula 2000; Miedany et al 2004). However MRI is more costly and less widely available than ultrasonography. Ultrasonography is a simple, noninvasive, and inexpensive tool that produces real-time images and does not expose the patient to radiation. Thus, ultrasonography is emerging as a good method for objectively evaluating the salivary glands.
Several typical ultrasound features of pSS have been described (Kawamura et al 1990; Mandel and Orchowski 1998; Makula 2000), although their incidence is low. Absence of typical ultrasound findings at the first visit should lead to sialography (Yousem et al 2000). In contrast, when the ultrasound scan suggests pSS, laboratory tests and/or lip biopsy can be performed. Significant differences in B-mode ultrasound features have been reported between patients with pSS and controls (Makula et al 1996). For instance, the salivary gland parenchyma is heterogeneous in pSS and homogeneous in healthy individuals. In our study, the images were normal in the controls (grade 0), whereas abnormalities in structure and size were noted in the patients. In our population, the size of parotid glands was significantly higher in the patients than in the controls. At the acute stage of pSS, the salivary glands are swollen and hypoechogenic (Ariji et al 1996; Salaffi et al 2000), often with marked heterogeneity due to inflammation, node enlargement, and myoepithelial hyperplasia. Furthermore, multiple cysts are found (Bradus et al 1988). In long-standing disease, in contrast, the salivary glands are usually small, hypoechogenic, and poorly demarcated (Gritzmann 2003; Howlett 2003). We found no significant difference in submandibular gland size between the controls and patients, probably because these glands are more difficult to delineate than the parotids. Another hypothesis could be that the absence of salivary gland hypertrophy at baseline explains the lower response to treatment.
Color Doppler sonography revealed salivary gland hyperemia in the patients with pSS (Martinoli et al 1994). Recently, color Doppler sonography was used to evaluate the vascular anatomy of the salivary glands in normal individuals (Martinoli et al 1994; Ariji et al 1998; Chikui et al 2000) and in patients with pSS (Martinoli et al 1994; Chikui et al 2000). Chikui and colleagues (2000) reported abnormalities in Doppler waveforms from the facial artery in patients with Sjögren’s syndrome compared with controls. Color Doppler evidence of salivary gland hyperemia has been described in patients with pSS (Gritzmann 2003). Hyperemia may cause a decrease in the resistive index of the facial artery. Martinoli and colleagues (1994) used color Doppler to evaluate the vascular anatomy of the salivary glands and the physiologic changes induced by lemon-juice stimulation. Stimulation led to a marked increase in color signals within the parenchyma and to the development of an aliasing artifact due to increasing flow velocities; arterial impedance decreased in the salivary vessels, causing the resistive index to diminish (Martinoli et al 1994). Resistive index values returned to normal within 20 seconds after the lemon juice was swallowed (Martinoli et al 1994). Carotti and colleagues (2001) reported that peak systolic velocity was more sensitive than the resistive index: in their study, resistive index values from the parotids and submandibular glands showed no significant changes after lemon stimulation in patients with pSS or in controls.
We showed that in healthy individuals the transverse facial artery generated a biphasic Doppler waveform, with a high systolic peak followed by a prominent compliance peak then by low diastolic flow. Normally, lemon stimulation increases the compliance peak and diastolic flow (Martinoli et al 1994). The Doppler waveform changes in the normal parotid glands after lemon stimulation were consistent with increased blood flow in the gland during secretory activity. In the patients with pSS, the resistive indices were significantly lower before stimulation than in the controls, and after stimulation the response of the transverse facial artery was blunted. As a result, the resistive index values after stimulation were similar in the healthy controls and the patients with pSS. A possible explanation for the impaired responses to stimulation in pSS is that the gland, being already hyperemic under basal conditions, may be refractory to stimulation. Moreover, in the pSS patients, the severity of gland damage assessed by ultrasound correlated with the resistive index. Under basal conditions, resistive index values were not significantly different between the subgroup with Grade 1 and 2 disease and the subgroup with Grade 3 or 4 disease. After lemon stimulation, in contrast, a clear difference was noted between these two subgroups, with significantly lower resistive index values in the patients who had more severe disease. Again, this finding suggests that basal hyperemia of the salivary glands may impair responses to stimulation. Whereas previous studies focused on the facial artery supplying the submandibular glands, we showed that inflow through the transverse facial artery supplying the parotid glands was also abnormal in patients with pSS.
In the patients with pSS, we evaluated the effects of rituximab therapy on the ultrasound features of the salivary glands. rituximab is a chimerical monoclonal antibody against CD20, which is carried by B cells. Doppler waveform analysis was performed before and after 12 weeks of rituximab treatment, using the same protocol. Under basal conditions, Doppler waveform parameters were not significantly different at baseline and after treatment (Figure 4). After lemon stimulation, however, the difference was significant, with rituximab inducing a higher systolic peak and lower diastolic flow. Furthermore, the waveform analysis of the transverse facial artery after stimulation, was abnormal before, but normal after, rituximab therapy. In particular, the resistive index value after stimulation in the treated patients was not very different from that in the controls. This favorable response to rituximab therapy may reflect B-cell infiltrate depletion and decreased inflammation in the glands. We did not measure the acceleration time after rituximab therapy, because it was not significantly different between the controls and the untreated patients.
In conclusion, both B-mode ultrasonography and color Doppler hold promise as noninvasive tools for studying salivary gland size and blood supply, either before or after stimulation of salivary secretion. Furthermore, color Doppler can be used to evaluate responses to treatment. However, additional studies of color Doppler as a monitoring tool are needed. We are currently starting a double blind prospective study evaluating rituximab versus placebo. If we confirm its efficacy, we will evaluate which parameters among clinical, biological or histological signs (Chisholm grade), new criteria of activity (Vitali et al 2007), or sonographic grades, are the best predictor of rituximab response.
Acknowledgments
This study received financial support from the Brest Hospital Center and the 2003 Clinical Research Hospital Program (PHRC 2003).
References
- Ariji Y, Ohki M, Eguchi K, et al. Texture analysis of sonographic features of the parotid gland in Sjögren’s syndrome. Am J Roentgenol. 1996;166:935–41. doi: 10.2214/ajr.166.4.8610577. [DOI] [PubMed] [Google Scholar]
- Ariji Y, Yvasa H, Ariji E. High-frequency color Doppler sonography of the submandibular gland: relationship between salivary secretion and blood flow. Oral Surg Oral Med Oral Pathol Oral Radiol Endosc. 1998;86:476–81. doi: 10.1016/s1079-2104(98)90378-x. [DOI] [PubMed] [Google Scholar]
- Bradus RJ, Hybarger P, Gooding GA. Parotid gland: US findings in Sjögren syndrome. Work in progress. Radiology. 1988;169:749–51. doi: 10.1148/radiology.169.3.3055038. [DOI] [PubMed] [Google Scholar]
- Carotti M, Salaffi F, Manganelli P, et al. Ultrasonography and colour doppler sonography of salivary glands in primary Sjögren’s sydrome. Clin Rheumatol. 2001;20:213–19. doi: 10.1007/s100670170068. [DOI] [PubMed] [Google Scholar]
- Chikui T, Yonetsu K, Izumi M, et al. Abnormal blood flow to the submandibular glands of patients with Sjögren’s syndrome: Doppler waveform analysis. J Rheumatol. 2000;27:1222–8. [PubMed] [Google Scholar]
- Chisholm DM, Mason DK. Labial salivary gland biopsy in Sjogren’s disease. J Clin Pathol. 1968;21:656–60. doi: 10.1136/jcp.21.5.656. [DOI] [PMC free article] [PubMed] [Google Scholar]
- Devauchelle-Pensec V, Pennec Y, Morvan J, et al. Improvement of Sjögren’s syndrome after two infusions of rituximab (anti CD20) Arthritis Rheum. 2007;57:310–17. doi: 10.1002/art.22536. [DOI] [PubMed] [Google Scholar]
- De Vita S, Lorenzon G, Rossi G, et al. Salivary gland echography in primary and secondary Sjögren’s syndrome. Clin Exp Rheumatol. 1992;10:351–6. [PubMed] [Google Scholar]
- Gritzmann N, Rettenbacher T, Hollerweger A, et al. Sonography of the salivary glands. Eur Radiol. 2003;13:964–75. doi: 10.1007/s00330-002-1586-9. [DOI] [PubMed] [Google Scholar]
- Howlett DC. High resolution ultrasound assessment of the parotid gland. Br J Radiol. 2003;76:271–7. doi: 10.1259/bjr/33081866. [DOI] [PubMed] [Google Scholar]
- Kawamura H, Taniguchi N, Itoh K, et al. Salivary gland echography in patients with Sjögren’s syndrome. Arthritis Rheum. 1990;33:505–10. doi: 10.1002/art.1780330407. [DOI] [PubMed] [Google Scholar]
- Mandel L, Orchowski YS. Using ultrasonography to diagnose Sjögren’s syndrome. J Am Dent Assoc. 1998;129:1129–33. doi: 10.14219/jada.archive.1998.0388. [DOI] [PubMed] [Google Scholar]
- Makula E, Pokorny G, Rajtar M, et al. Parotid gland ultrasonography as a diagnostic tool in primary Sjögren’s syndrome. Br J Rheumatol. 1996;35:972–7. doi: 10.1093/rheumatology/35.10.972. [DOI] [PubMed] [Google Scholar]
- Makula E, Pokorny G, Kiss M, et al. The place of magnetic resonance and ultrasonographic examinations of parotid gland in the diagnosis and follow-up of primary Sjögren’s syndrome. Rheumatology. 2000;39:97–104. doi: 10.1093/rheumatology/39.1.97. [DOI] [PubMed] [Google Scholar]
- Martinoli C, Derchi LE, Solbiati L, et al. Color Doppler sonography of salivary glands. Am J Roentgenol. 1994;163:933–41. doi: 10.2214/ajr.163.4.8092039. [DOI] [PubMed] [Google Scholar]
- Miedany YM, Ahmed I, Mourad HG, et al. Quantitative ultrasonography and magnetic resonance imaging of the parotid gland: can they replace the histopathologic studies in patients with Sjögren’s syndrome. Joint Bone Spine. 2004;71:29–38. doi: 10.1016/j.jbspin.2003.04.003. [DOI] [PubMed] [Google Scholar]
- Pijpe J, van Imhoff GW, Spijkervet FK, et al. Rituximab treatment in patients with primary Sjogren’s syndrome: An open-label phase II study. Arthritis Rheum. 2005;52:2740–50. doi: 10.1002/art.21260. [DOI] [PubMed] [Google Scholar]
- Salaffi F, Argalia G, Carotti M, et al. Salivary gland ultrasonography in the evaluation of primary Sjögren’s syndrome Comparison with minor salivary gland biopsy. J Rheumatol. 2000;27:1229–36. [PubMed] [Google Scholar]
- Seror R, Sordet C, Guillevin L, et al. Tolerance and efficacy of rituximab and changes in serum B-cell biomarkers in patients with systemic complications of primary Sjogren’s syndrome. Ann Rheum Dis. 2007;66:351–7. doi: 10.1136/ard.2006.057919. [DOI] [PMC free article] [PubMed] [Google Scholar]
- Somer BG, Tsai DE, Downs L, et al. American College of Rheumatology ad hoc Committee on Immunologic Testing Guidelines. Improvement in Sjogren’s syndrome following therapy with rituximab for marginal zone lymphoma. Arthritis Rheum. 2003;49:394–8. doi: 10.1002/art.11109. [DOI] [PubMed] [Google Scholar]
- Vitali C, Bombardieri S, Jonsson R, et al. European Study Group on classification criteria for Sjögren’s syndrome. Classification criteria for Sjögren’s syndrome: a revised version of the European criteria proposed by the American-European Consensus Group. Ann Rheum Dis. 2002;61:554–8. doi: 10.1136/ard.61.6.554. [DOI] [PMC free article] [PubMed] [Google Scholar]
- Vitali C, Palombi G, Baldini C, et al. Sjogren’s Syndrome Disease Damage Index and disease activity index: scoring systems for the assessment of disease damage and disease activity in Sjogren’s syndrome, derived from an analysis of a cohort of Italian patients. Arthritis Rheum. 2007;56:2223–31. doi: 10.1002/art.22658. [DOI] [PubMed] [Google Scholar]
- Yoshiura K, Yuasa K, Tabata O, et al. Reliability of ultrasonography and sialography in the diagnosis of Sjögren’s syndrome. Oral Surg Oral Med Oral Pathol Oral Radiol Endod. 1997;83:400–7. doi: 10.1016/s1079-2104(97)90249-3. [DOI] [PubMed] [Google Scholar]
- Yousem DM, Kraut MA, Chalian AA. Major salivary gland imaging. Radiology. 2000;216:19–29. doi: 10.1148/radiology.216.1.r00jl4519. [DOI] [PubMed] [Google Scholar]


