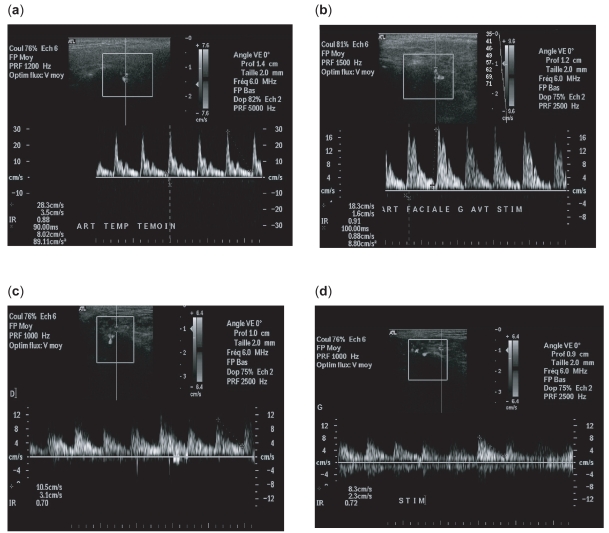
Figure 3.
At baseline. (a) Doppler waveform without lemon stimulation: control population. High systolic peak and a prominent following compliance peak, followed by a low diastolic flow (RI = 0.88). (b) Doppler waveform with lemon stimulation: control population. Physiologic changes in vasculature when parotid gland is stimulated in controls. Level of systolic and diastolic flow is increased (RI = 0.91). (c) Doppler waveform in patient population without stimulation. We noted a decreased impedance in parotid vessels with a decrease RI (RI = 0.77). (d) Doppler waveform with lemon stimulation: patients. The waveform profile is the same before and after stimulation.

