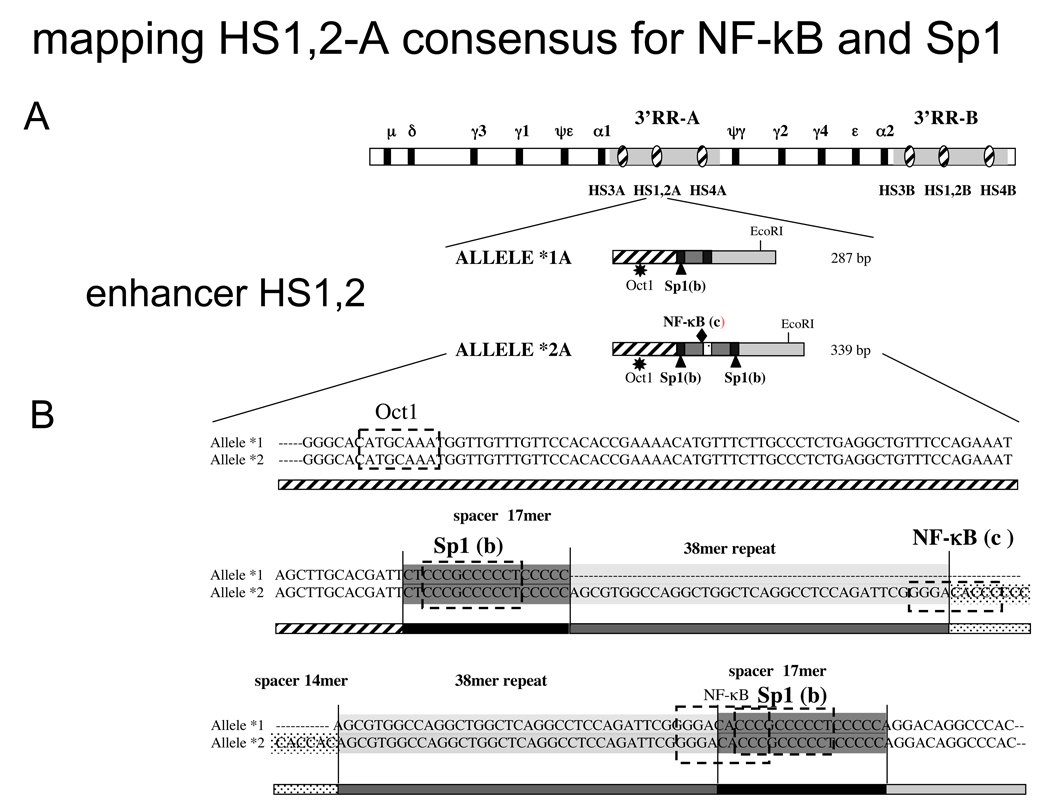
Figure 1.
A) Schematic map of the Ig heavy chain constant genes with the two 3’ Regulatory Regions showing the relative position of the three enhancers HS3*A, HS3*B, HS1,2*A, HS1,2*B, HS4*A, HS4*B. In the lower part the schematic representation of allele *1A and *2A with the Oct1 site (star), Sp1 sites (triangle) and NF-κB site (diamond).
B) Alignment of HS1,2A alleles *1A and *2. On the sequence alignments are reported the predicted binding sites for Oct-1, Sp1 and NF-κB as determined by in silico analysis with “transfac” program. The letters in brackets correspond to the bands of EMSA in Figure 2.

