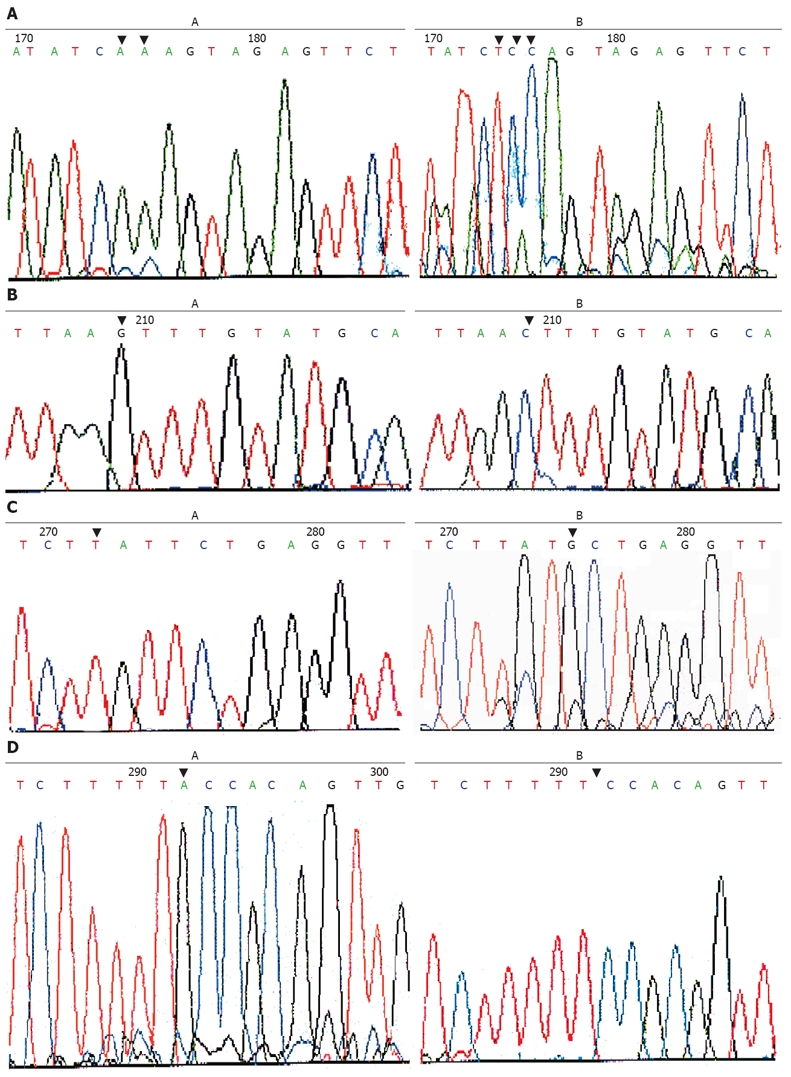
Figure 2.

AA-TCC mutation at 40 bp upstream of 3’ lateral in exon 7 (A), G-C point mutation at 91 bp upstream of 5’ lateral exon 5 (B), T-G point mutation at 24 bp upstream (C) and single base A mutation at 7 bp upstream (D) of 5’ lateral exon 5 in paired paracancerous and gastric cancer tissue samples.
