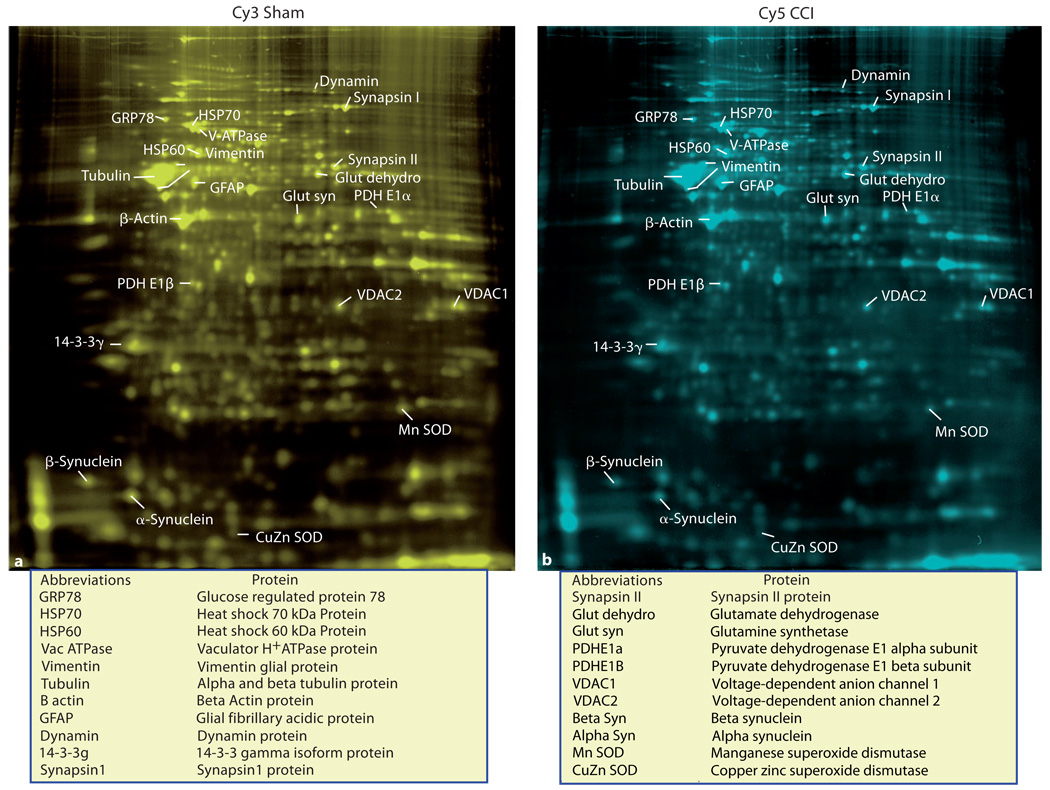
Fig. 1.
Gels from a paired sample that have been colorized (colors are not the actual color of the Cy3 and Cy5 cyanine dyes) to make spot detection and annotation more visible. The relative positions and signal strength of the major proteins that showed a significant change 2 weeks after moderate CCI are shown in a paired sham (a) and CCI (b) sample for comparison.

