
Figure 6. PKCα and PKCδ differentially suppress anchorage-independent growth of CRC cells.
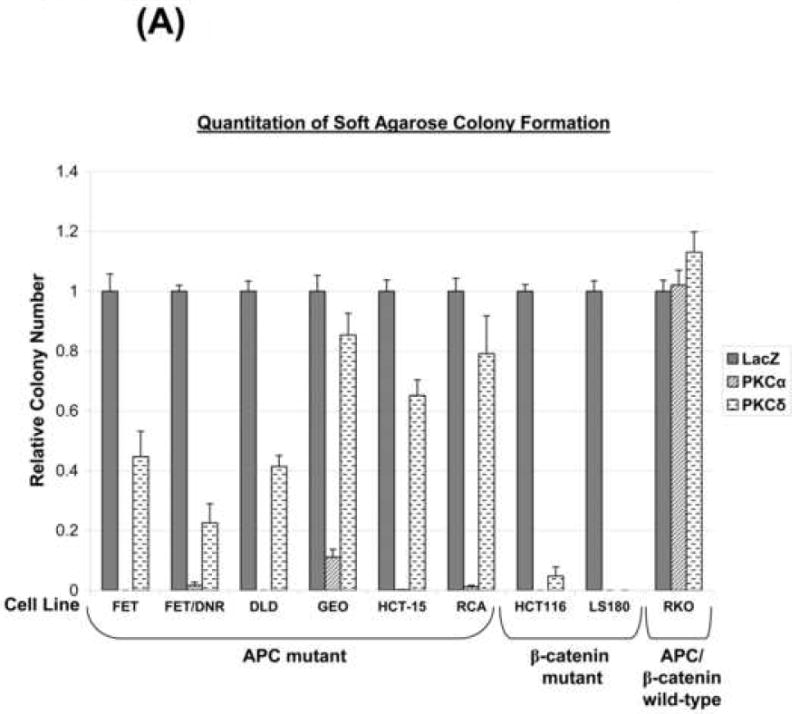
(A) CRC cells were infected with LacZ, PKCα, or PKCδ adenovirus as indicated and plated in soft agarose. Quantification (average of ≥2 independent experiments ± s.e.) of colony formation is presented relative to LacZ control. All samples transduced with PKCα were significantly different from LacZ-transduced controls (P< 0.05) except for RKO cells.
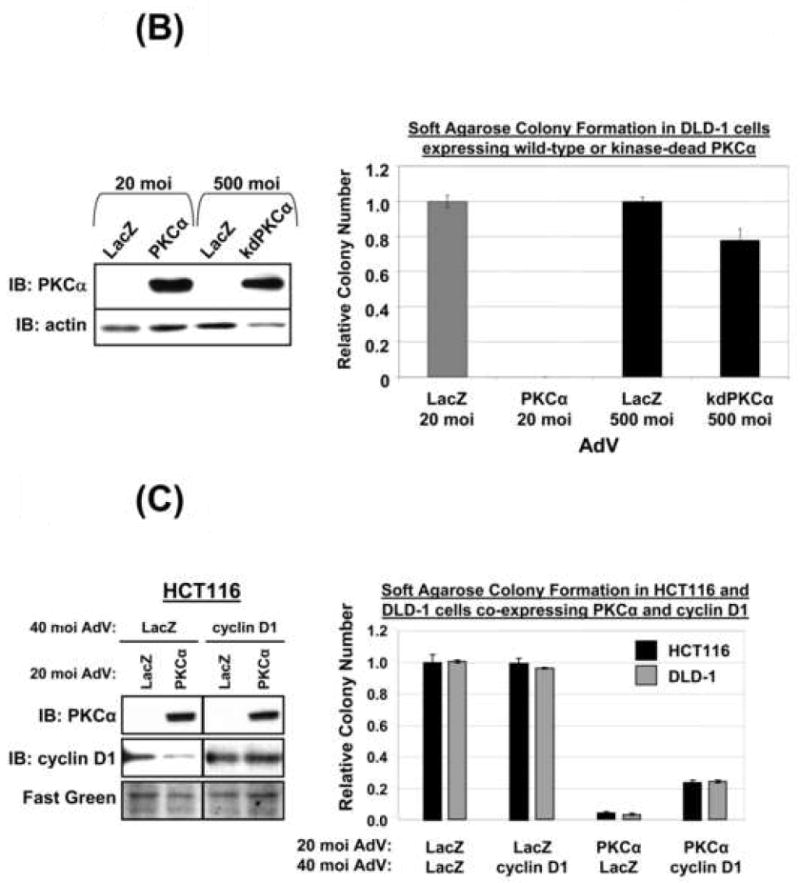
(B) DLD-1 cells were infected with LacZ, PKCα or kdPKCα adenovirus as indicated and subjected to immunoblot analysis (left panel) or soft agarose colony formation assays (right panel). Data represent the average of two independent experiments (± s.e.).
(C) DLD-1 and HCT116 cells were infected with indicated combinations of PKCα, LacZ and cyclin D1 adenovirus and analyzed by immunoblotting (Left panel) or colony formation in soft agarose (quantified as in A, Right panel). Data represent the average of 3 independent experiments ± s.e. Similar results were obtained using 20 moi cyclin D1 adenovirus.