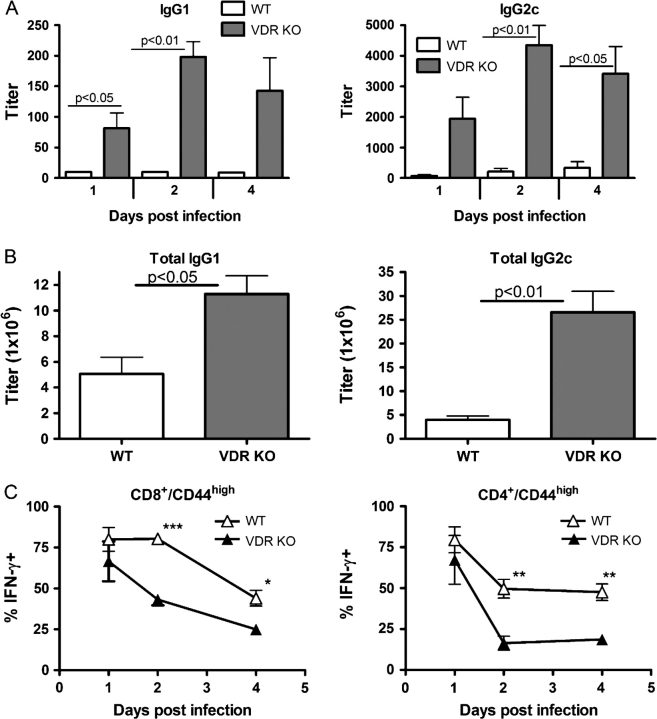
Fig. 6.
B cell and T cell memory function in old VDR KO and WT mice following secondary challenge with Listeria monocytogenes. (A) Listeria-specific IgG1 and IgG2c responses following secondary challenge with L. monocytogenes. (B) Total IgG1 and IgG2c in old mice. C) Average percentage of IFN-γ-producing CD8/CD44high and CD4/CD44high T cells in old VDR KO and WT mice. Values are the mean ± standard error of the mean of n = 3–4 individual mice per time point. VDR KO value is significantly different than the corresponding WT value, *P ≤ 0.05, **P ≤ 0.001, ***P ≤ 0.0001.

