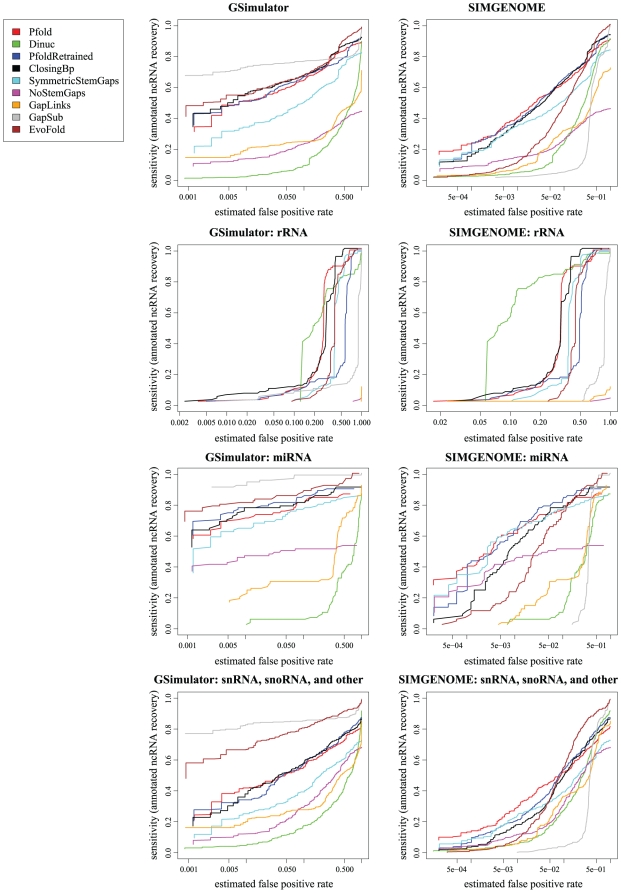
Figure 1. ROC curves comparing ncRNA gene prediction performance on various subsets of D. melanogaster ncRNAs.
The ROC curves on the left used simulated data generated by gsimulator, which models neutrally evolving DNA (i.e., loosely speaking, intergenic regions). The ROC curves on the right used simulated data generated by simgenome, which additionally includes conserved signals such as protein-coding exons (i.e. it models both intergenic and gene regions). Both simulated datasets were re-aligned with PECAN prior to gene-prediction. Each row represents a different subset of true D. melanogaster ncRNAs: the top row includes all ncRNAs, the second row rRNA only, the third row miRNA only, and the bottom row includes snRNAs, snoRNAs and other “small” families (excluding tRNA and rRNA). We tested several prediction grammars including “Pfold”, based on the original PFOLD grammar [30]; “PfoldRetrained”, a version of PFOLD reparameterized from the mix80 dataset [38]; “Dinuc”, a derivative of PFOLD with a dinucleotide null model; “ClosingBp”, a derivative of PFOLD that explicitly models the closing basepair statistics of loops; “SymmetricStemGaps”, a derivative of PFOLD that excludes deletions of only one half of a basepair; “NoStemGaps”, an even stricter derivative of PFOLD that excludes gaps in stems altogether; “GapLinks”, a PFOLD-derivative that approximately models gaps as a birth-death process; “GapSub”, a PFOLD-derivative that approximately models gaps as a substitution process; and “EvoFold”, the grammar used by the program EvoFold [10]. The horizontal axis (false positive rate) is plotted logarithmically, so as to reveal the behavior in the low-false-positive regime, which is primariy of interest (the left-hand side of the plots). Note that these screens were performed on aligned genome data, and in particular, note that not all of the genome is contained within such alignments. Our procedure can only discover ncRNAs that are contained within one of the aligned regions. Since some of the D. melanogaster ncRNAs are not contained within the PECAN alignments, these ncRNAs are never discovered; hence, the sensitivity never reaches 1 in these curves (so they are non-standard ROC curves in that sense).

