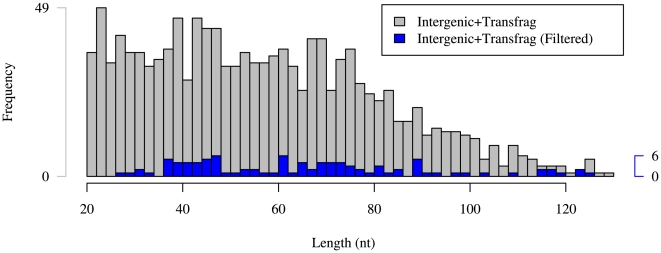
Figure 5. Length distribution of predictions in intergenic sequence which overlap embryonic transcriptional data.
Grey denotes all Intergenic+Transfrag predictions and blue denotes Intergenic+Transfrag predictions which pass our filtering criteria. Longer predictions, with their generically longer stems, are more likely to exhibit the compensatory mutations required by our filtering criteria, thereby flattening the distribution.

