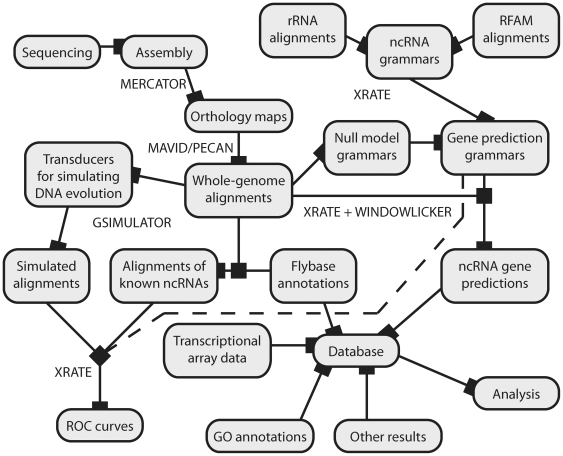
Figure 9. Conceptual overview of the steps in our analysis pipeline, including model parameterization (“training”); generation of simulated datasets; model evaluation (ROC curves); genome-wide prediction of conserved ncRNAs; and analysis of predictions.
Rebuilding of any part of the graph is fully automated using make: Nodes represent targets and edges represent dependencies. Names of programs used in key steps (xrate, windowlicker.pl, MAVID, etc.) are shown near the relevant edges in the graph.

