
Fig. 3.
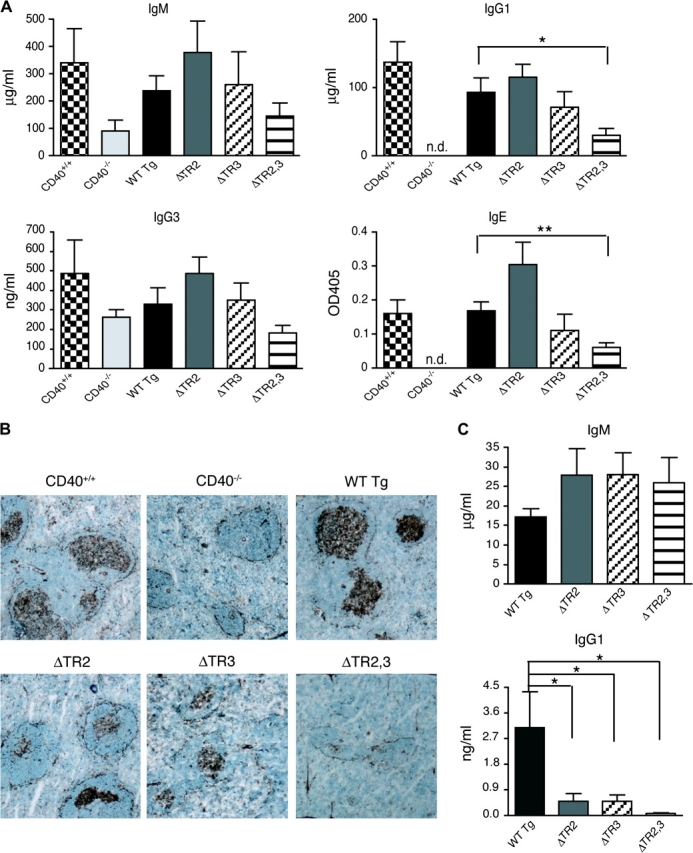
Antibody response and GC formation in response to TD antigen. (A) IgM, IgG1, IgG3 and IgE KLH-specific antibody responses to immunization with 400 μg KLH (ND = not detectable). (B) GCs in representative spleen sections (×40) from mice immunized with KLH examined for peanut agglutinin binding. (C) IgM and IgG1 KLH-specific antibody responses to immunization with 100 μg KLH. Statistical analysis was performed as in Fig. 2.