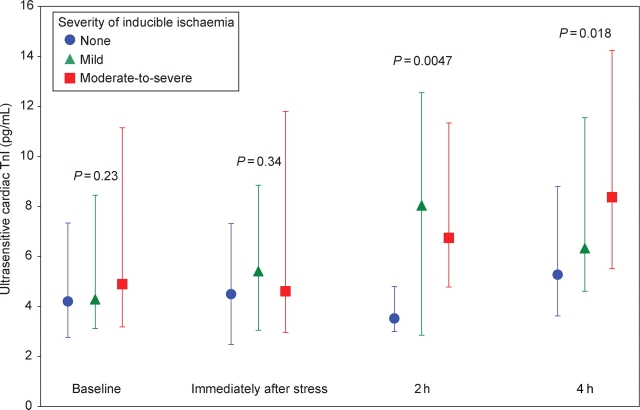
Figure 1.
Cardiac troponin I levels (median and interquartile range) measured using the ultrasensitive assay in patients with none (blue circles), mild (green triangles), and moderate-to-severe (red squares) ischaemia at baseline (samples available in 44, 30, and 34 patients, respectively), immediately after stress testing (37, 26, and 27 patients), 2 h after stress testing (20, 15, and 16 patients), and 4 h after stress testing (44, 28, and 36 patients). P-values are for trend across ischaemic categories at each timepoint.

