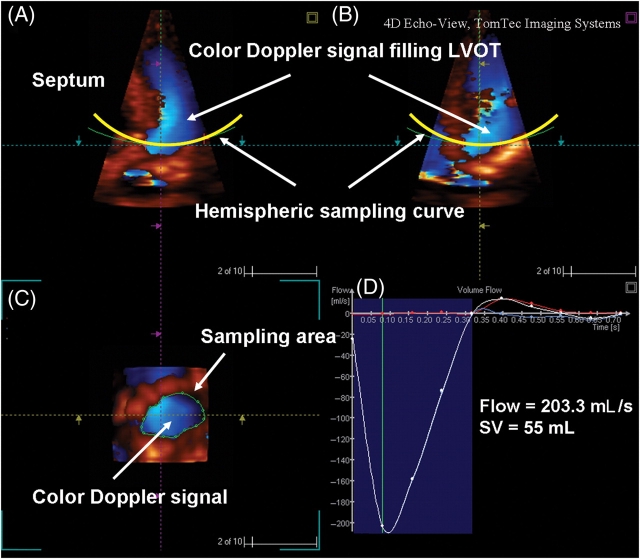
Figure 2.
(A and B) Three-dimensional projections showing colour Doppler filling the LVOT. Sampling curve captured velocity vectors perpendicular to the hemispheric concave surface. (C) Region of interest was traced and the Tomtek software automatically calculated the forward flow in systole over time. (D) Derivation of stroke volume (SV) was obtained by integration of area under the flow-vs.-time curve. Cardiac output was calculated from the product of SV and heart rate.

