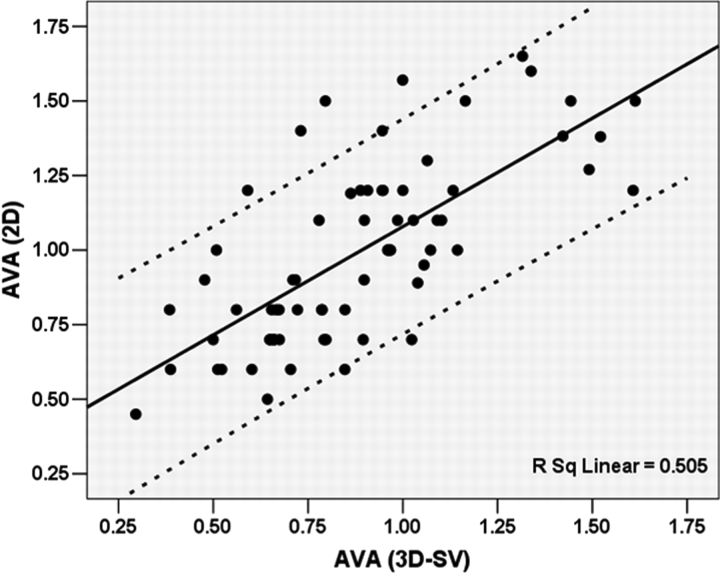
Figure 4.
Scatter plot of correlation between aortic valve area calculated from two-dimensional echocardiography derived continuity equation [AVA(2D)] and that obtained from real-time three-dimensional stroke volume quantification [AVA(3D-SV)]. Dashed lines represent 95% prediction band of the regression line.

