Figure 2:
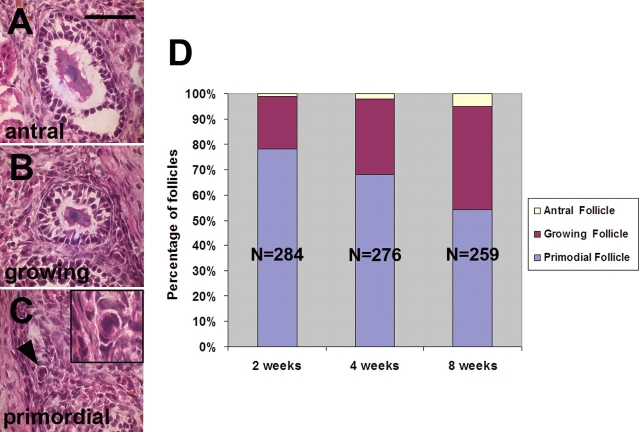
The progression of folliculogenesis in ovary transplants. (A–C) Haematoxylin and eosin stained sections of ovarian grafts illustrating the morphology of antral (A), growing (B) and primordial (C) follicles. Inset in C is a higher magnification of the follicle indicated by the arrowhead. (D) Stacked histograms showing the proportion of primordial, growing and antral follicles observed in transplanted ovarian grafts recovered at the three time points indicated. The decreasing proportion of immature, primordial follicles with time reflects the progression of folliculogenesis. Each bar represents counts from 10 grafts; N, number of follicles scored. Bar = 50 µm.

