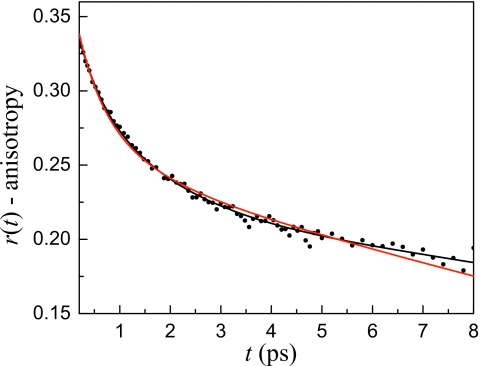
Figure 10.
Anisotropy decay at 2599 cm−1 for the w0=10 reverse micelle. The red solid line is the result of a simultaneous fit of the anisotropy and lifetime decays for a range of frequencies assuming the same time constants as the large reverse micelles. The fit misses the data at both short and long times. The black solid line is the result of a simultaneous fit of the anisotropy and lifetime decays for a range of frequencies allowing the lifetimes and orientational times to vary but restricting them to be slower than bulk water and the interfacial water found in the large reverse micelles.

