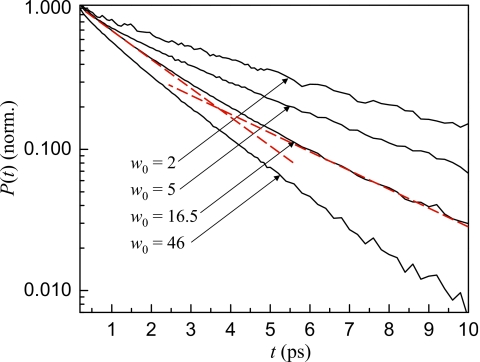
Figure 4.
Semilog plot of the vibrational population relaxation of the OD stretch at 2548 cm−1 for a range of reverse micelle sizes. As the reverse micelle size decreases, the vibrational relaxation becomes slower. All decays are biexponential, as shown by the deviation from the straight dashed lines for the w0=16.5 data.

