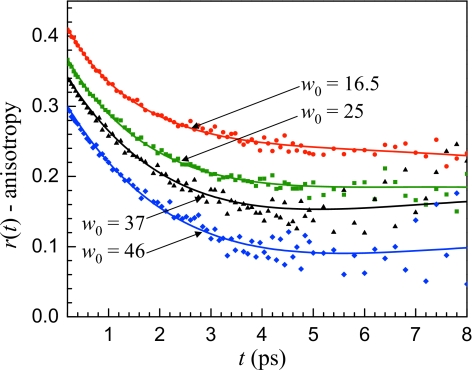
Figure 5.
Anisotropy decays at 2578 cm−1 for the large reverse micelles. The solid lines are the results of simultaneous fits of the vibrational population relaxation and anisotropy decays for a range of frequencies for each reverse micelle based on a two component model consisting of a bulk water core and interfacial water.

