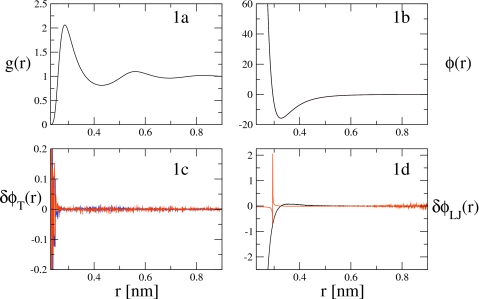
Figure 1.
Force and pair distribution curves plotted for the LJ liquid system: (a) is the RDF, g(r), plotted as a function of distance, r, and computed from a simulation at 298 K. (b) compares the true LJ pair force (black) at T=298 K with the pair forces calculated for the LJ system at T′=318 K (red) andT′=278 K (blue) using the rescaling procedure with simulation data from T=298 K and also with the pair force calculated using the normal equations at T=298 K (dotted black). (c) displays the absolute error in the rescaling procedure, δϕT, by plotting the difference between the LJ pair force computed from the MS-CG normal equations at T=298 K and the LJ pair forces at T′=278 K (blue) and T′=318 K (red) computed via the rescaling procedure and using simulation data from T=298 K. (d) presents the percentage error (red) and absolute error (black) in the LJ pair force, δϕLJ, calculated using the normal MS-CG equations compared to the true LJ pair force.

