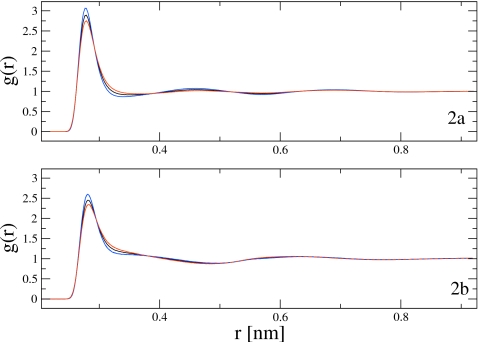
Figure 2.
Comparison of RDFs derived from MD simulations of all-atom and CG models of water at three different temperatures: (a) presents the RDFs calculated from all-atom MD simulations. The blue, black, and red solid curves correspond to RDFs calculated from all-atom MD simulations of SPC water at 278, 298, and 318 K, respectively. (b) presents RDFs calculated from CG MD simulations. The blue, black, and red solid curves correspond to RDFs calculated at 278, 298, and 318 K, respectively, using pair forces calculated via the normal MS-CG equations in Eq. 34. The blue and red dashed curves correspond to RDFs calculated from CG MD simulations at 278 and 318 K using pair forces calculated via the rescaled normal MS-CG equations in Eq. 37. The RDFs for the CG MD simulations at each temperature are indistinguishable on the scale of the figure.

