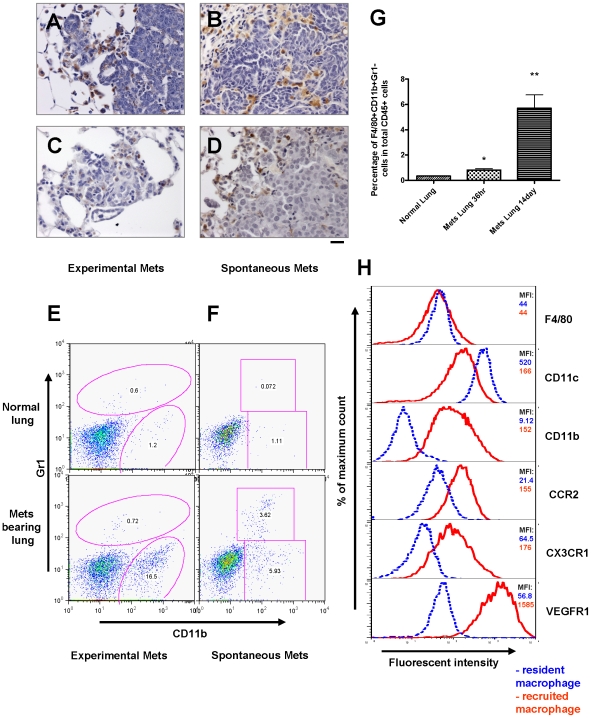
Figure 3. Recruitment of a distinct macrophage population in metastasis bearing lungs.
(A–D) Pulmonary metastasis of breast cancer cells are highly infiltrated with macrophages. Representative Mac3 immunohistochemistry staining of transverse sections of lung metastatic lesions from different tumor models: (A) experimental metastasis of primary PyMT tumor cells; (B) spontaneous metastasis derived from a MMTV-PyMT induced mammary tumor; (C) experimental metastasis of Met-1 cells and (D) spontaneous metastasis derived from subcutaneously implanted MDA-231 cells. Bar equals 20 um. (E) Representative flow diagram of CSF-1R-GFP positive cells from normal lung (upper panel) and metastasis bearing lung from experimental metastasis assay of Met-1 cells (lower panel). n = 5 (F) Representative flow diagram of CSF-1R-GFP positive cells from normal lung (upper panel) and lung bearing spontaneous metastasis from MMTV-PyMT induced mouse mammary tumor (lower panel). n = 3 (G) Recruitment of CD11b+Gr1- macrophages (F4/80+) in lungs with experimentally induced metastasis with Met-1 cells. Lungs were harvested at time indicated after tumor cell i.v. injection. Data are shown as mean+SEM. n = 3, *p<0.05 and **P<0.01. (H) Representative flow histograms of normal lung macrophages (F4/80+, blue dashed line) versus recruited macrophage population (F4/80+CD11b+Gr1-, red solid line) from lungs bearing Met-1 cell metastases stained with antibodies of different cell surface makers (indicated at the right side of the histogram). X axis indicates the fluorescent intensity, Y axis indicates the percentage of maximum cell number, MFI (top right panel) denotes representative mean fluorescent intensity (n = 3).

