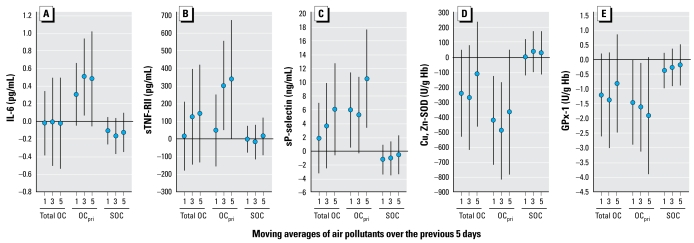
Figure 3.
Associations of biomarkers with indoor and outdoor OC on days 1, 3, and 5: differences by OCpri and SOC fractions. Expected change in the biomarker (adjusted coefficient and 95% CI) corresponds to an interquartile range change in the air pollutant (Table 3). Models for sTNF-RII and sP-selectin are restricted to 44 subjects living in the San Gabriel Valley.

