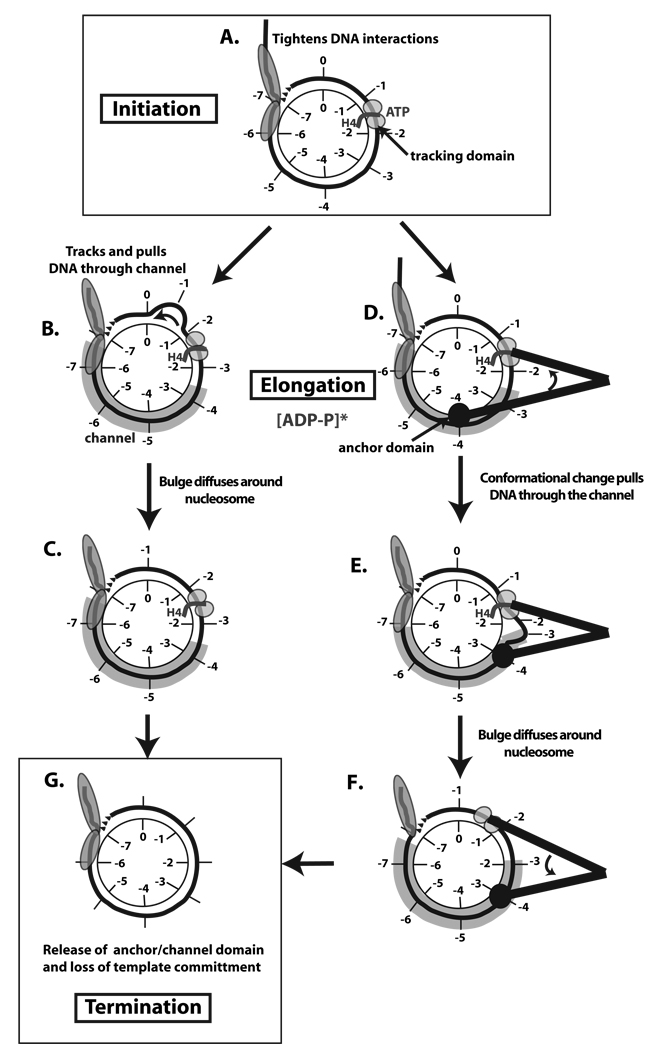
Figure 7. Model for initiation, elongation, and termination phases in ISW2 remodeling of nucleosomes.
The nucleosome is represented as having its histone core in the center with only one DNA gyre (black line) evident and some extranucleosomal DNA. The initial superhelical locations on the DNA and histone core are separately labeled 1 thru 7 to track DNA movement relative to the histone octamer surface in this model. ISW2 interactions with DNA are shown in gray with the putative tracking, anchor, and channel domains labeled. The initiation (A), elongation (B–F), and termination (G) stages of ISW2 remodeling are displayed with two alternative models for elongation of the remodeling complex. In B–C the primary mode of nucleosome movement is tracking of DNA through the ATPase domain of ISW2. The other model for nucleosome movement uses large shifts in conformation represented as two black lines to help illustrate the protein structure that ties the two domains together. The distance between the domains changes as ATP is hydrolyzed due to conformational shifts.

