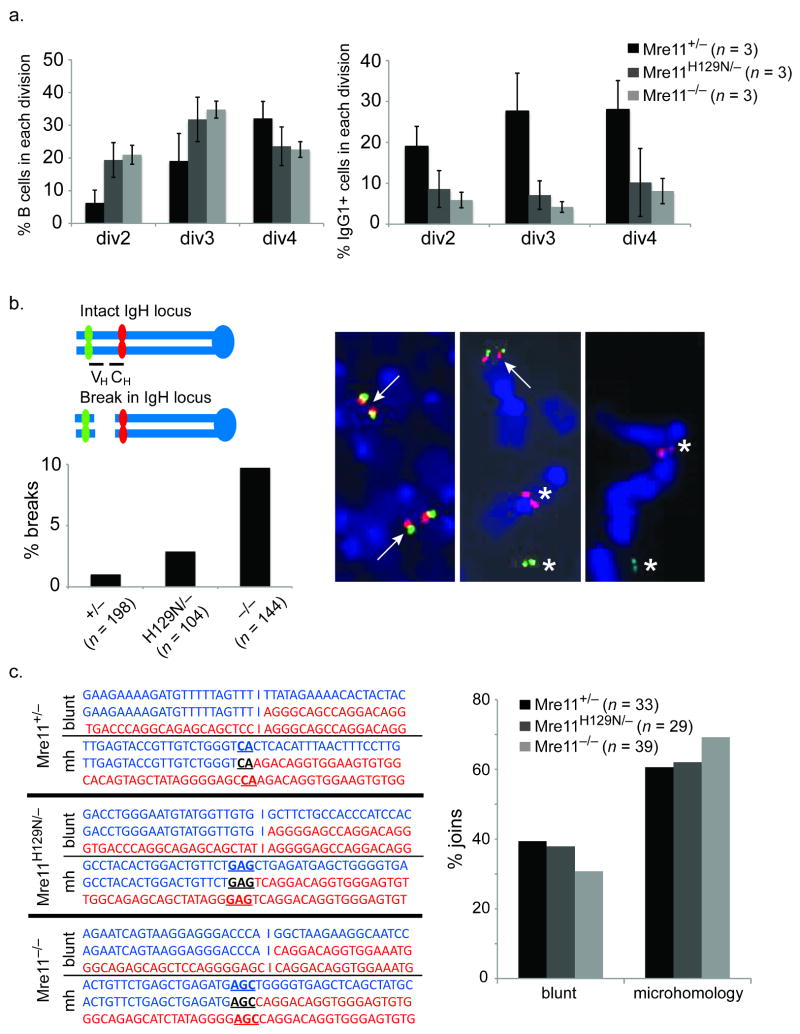
Figure 3. Requirement for MRN in the repair process.
(a) Reduced class switching in MRN deficiencies does not result from proliferation defects. Left - The cell tracking dye CFSE was used to distinguish populations of stimulated B cells having undergone the indicated number of divisions (x axis). The percentage of cells in each population is shown on the Y axis. Reduced proliferation in the Mre11 deficiencies is evident. Right - the percentage of cells in each population (x axis) having switched to IgG1. Reduced switching is evident in each population. (b) Chromosome breakage in the IgH locus. Two color FISH with BACs flanking IgH on mouse chromosome 12 reveals IgH breaks by separation of red (BAC 199) and green (BAC 207) signals. The representative examples show a normal metaphase (left) and two with an IgH break (center and right). Arrows indicate co-localized signals (intact). Asterisks indicate separated signals (broken). The bar graph depicts the percentage of metaphases with an IgH break. Three mice of each genotype were analyzed. The total number of metaphases analyzed are indicated below each genotype. (c) Mre11 deficiencies impact the Classic and Alternative end joining pathways. Left - Representative sequences of cloned joins involving the mu and gamma 1 switch regions. Right - The distribution of joins containing blunt ends (Lig4/XRCC4 dependant, classic NHEJ) and microhomologies (Lig4/XRCC4 independent, alternative NHEJ) are shown. Three mice of each genotype were analyzed. The total number of sequenced joins are indicated.

