
Figure 1.
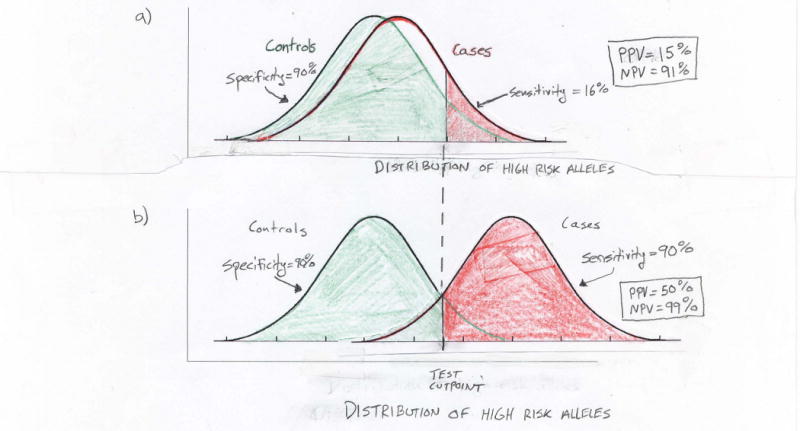
Limitations of using multiple associated variants to predict an individual's risk of prostate cancer. Plots show hypothetical normal distributions of high risk alleles among cases and controls. a) Recent work suggests that men in the 90th percentile of risk allele counts have a two- to four-fold increase in prostate cancer risk in comparison to men in the 10th percentile. Even at the higher bound of this range (i.e., odds ratio equal to four), the case and control distributions of high risk alleles largely overlap. With such overlap a genetic screening test will perform poorly. For example, while a test based on being in the top decile of risk alleles (above cutpoint in figure) has 90% specificity (i.e., proportion of true negatives determined by the test) and negative predictive value (NPV) = 91%, it has only 16% sensitivity (i.e., the proportion of true positives determined by the test) and positive predictive value (PPV) = 15%. Here the cutpoint is based on the control distribution and the disease prevalence is assumed to equal 10%. b) Using this same genetic test to achieve sufficient separation between the case and control distributions of risk alleles for 90% sensitivity and specificity will require odds ratios substantially larger than those anticipated from GWAS, even if many SNPs are combined into a single predictor of prostate cancer.