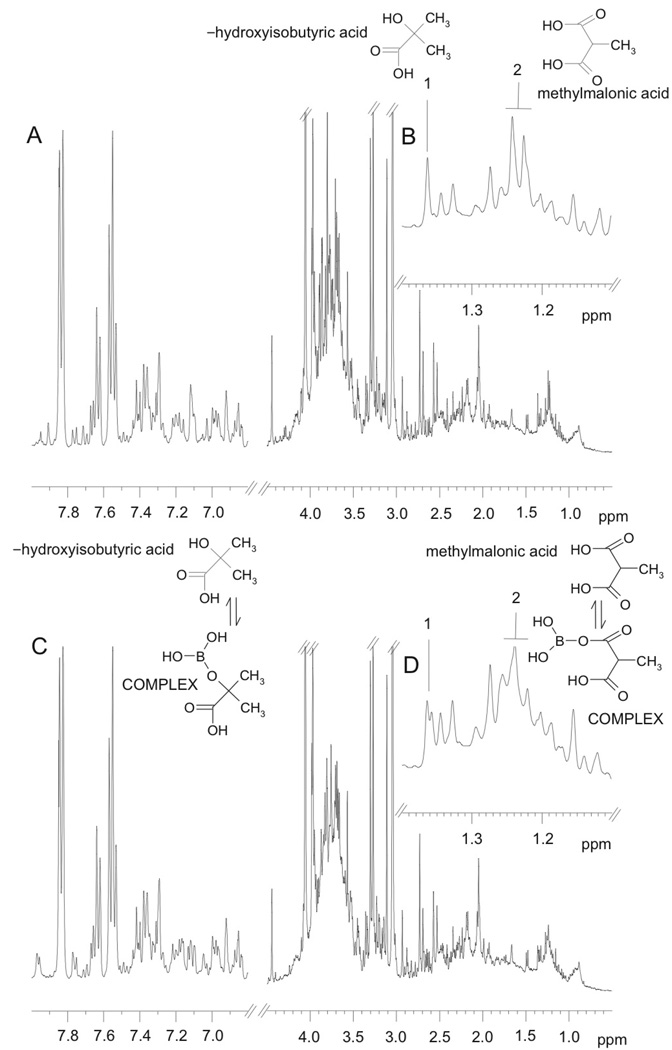
Figure 1.
Typical 1H NMR spectra of control human urine samples containing: (A) no borate; (B) expansion of the region between δ1.1–1.4 from A; (C) the same sample with added 30.73 mM borate; (D) expansion of the region between δ1.1–1.4 from C. Peaks annotated “1” and “2” correspond to α-hydroxyisobutyric acid and methylmalonic acid, respectively, either free (in A and B) or in complex with borate (in C and D).

