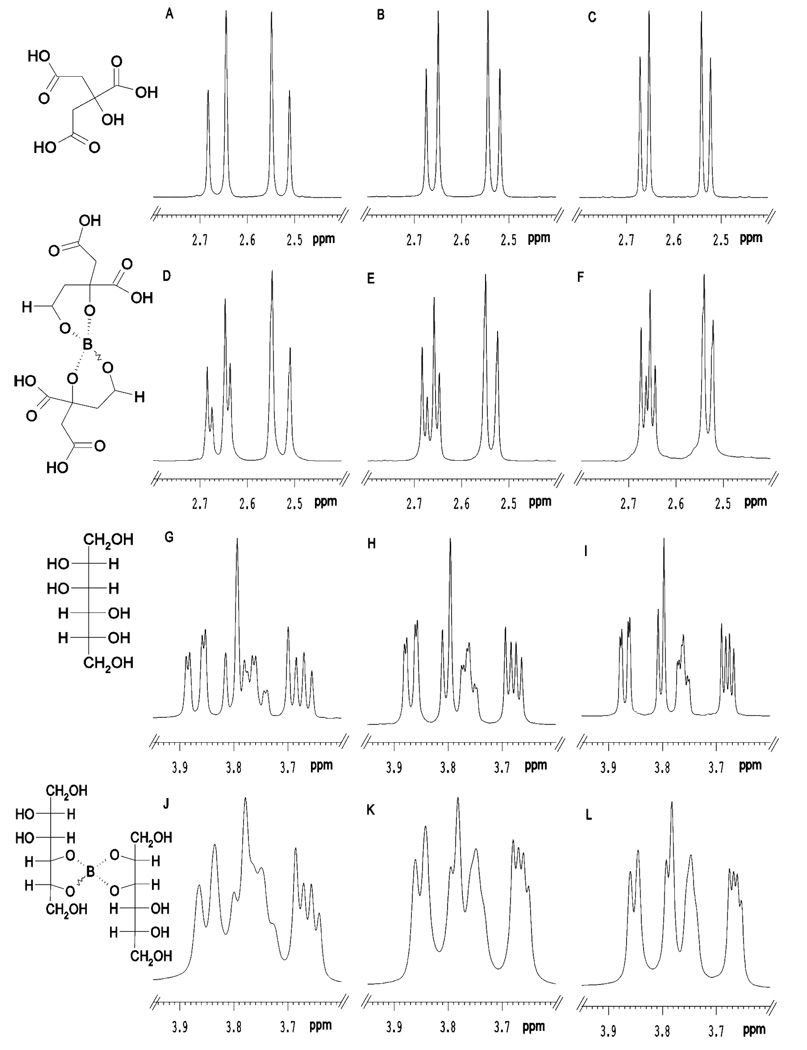
Figure 2.
1H NMR spectra of a standard solution containing: (A–C) citrate, (D–F) citrate/borate complex, (G–I) mannitol, (J–L) mannitol/borate complex. A, D, G and J are data acquired at 400 MHz, B, E, H and K are data acquired at 600 MHz and C, F, I and L are data acquired at 800 MHz. Proposed structures of these compounds and their complexes are given in the left hand panel of the figure.

