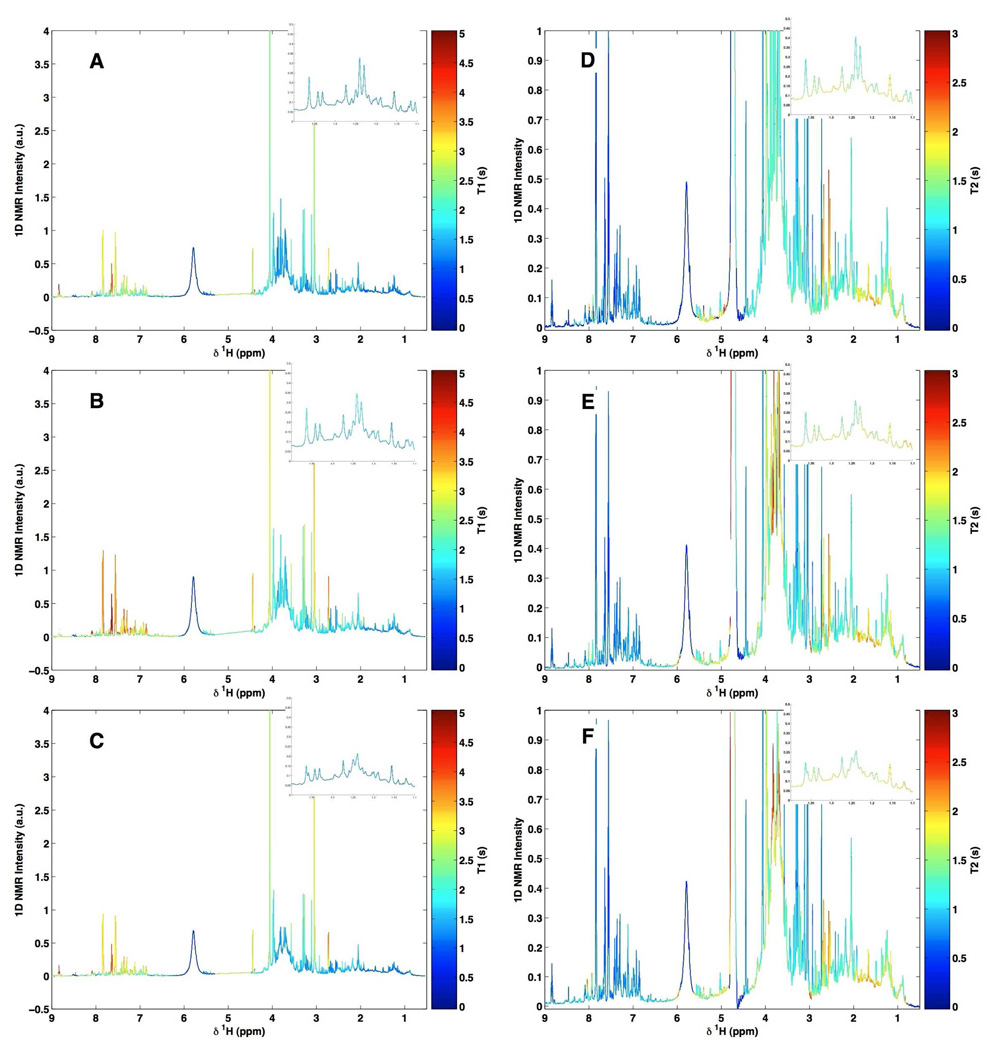
Figure 4.
600 MHz TOPSY spectra from a quality control urine sample supplemented with different amounts of borate. (A and D) borate-free urine sample, (B and E) the same urine sample supplemented with 3.07 mM borate and (C and F) the same urine sample supplemented with 30.7 mM borate. In A, B and C, the color scale represents T1 values projected onto the 1D spectrum. In D, E and F, the color scale represents T2 values projected onto the 1D spectrum.

