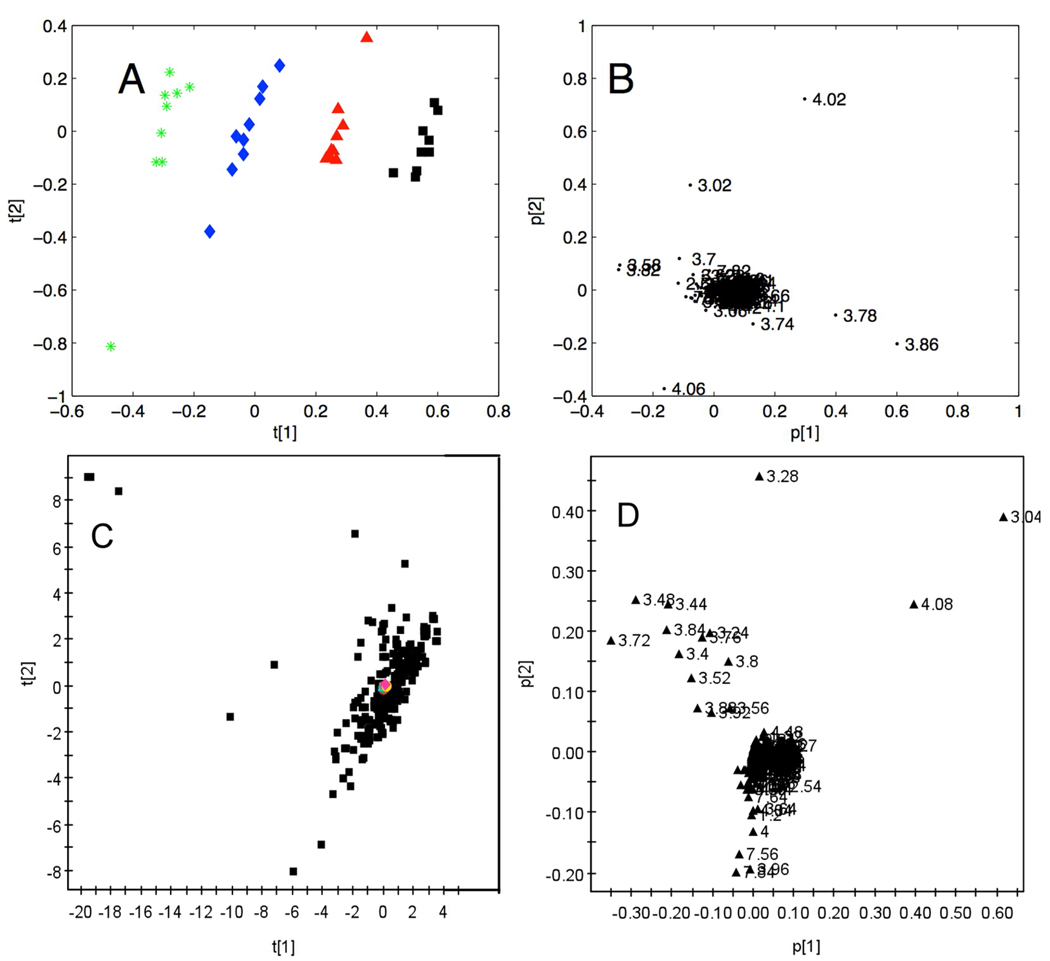
Figure 5.
(A) PC1 v. PC2 scores plot of 1H NMR spectral data from urine samples with varying borate concentrations and storage times. The four concentrations of borate are 0 (green), 3.07(blue), 16.90 (red) and 30.73 (black) mM in urine at 9 time points over a period of 12 months; (B) PCA loading plot for the scores in A; (C) PC1 v. PC2 scores plot of 1H NMR spectral data from samples with varying borate concentrations (0, 3.07, 16.90 and 30.73 mM in urine) shown in red, and 200 urine sample from a typical western population shown in black; (D) PCA loading plot for the scores in (C). All data in A and B were acquired at 400 MHz, all data in C and D were acquired at 600 MHz observation frequencies.

