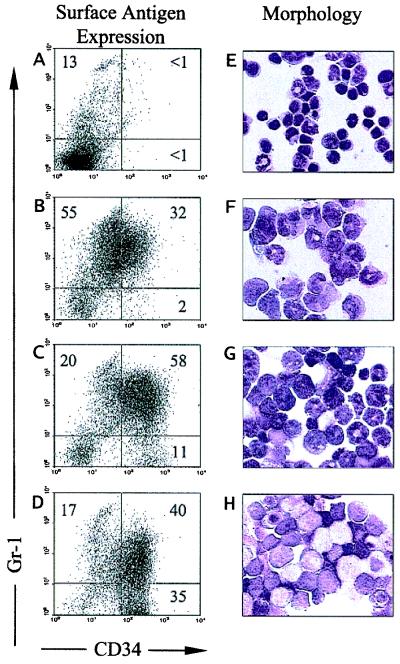
Figure 2.
Staging of APL tumors. (A--D) Flow cytometric analysis of spleen cells from a wild-type mouse (A) or spleen cells from mice dying with APL (B–D) for expression of Gr-1 and CD34. (E–H) Wright-Giemsa stains of the same splenic cells shown in A–D. Samples are as follows: (A and E) wild-type spleen; (B and F) a highly differentiated stage 1 tumor from mouse 10836; (C and G) an intermediate stage 2 APL tumor from mouse 13080; (D and H) an immature stage 3 APL tumor from mouse 11309.

