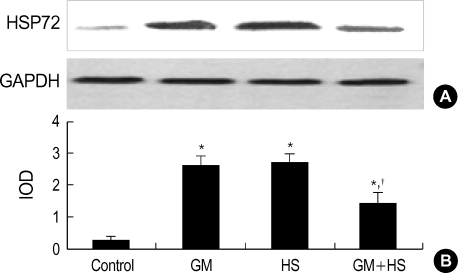
Fig. 7.
Expression of HSP72 in HK-2 cells. (A) Western-blot analysis of HSP72 and GAPDH expression in HK-2 cells treated with medium only, HS, GM in 100 µg/mL and GM+HS, respectively, for 72 hr. (B) Quantification of HSP72 expression by densitometer. Values are mean±SD of measurements from separate HK-2 cell cultures. Number of experiments (n)=6. *p<0.01 vs. control, †p<0.01 vs. GM group at the same time point.

