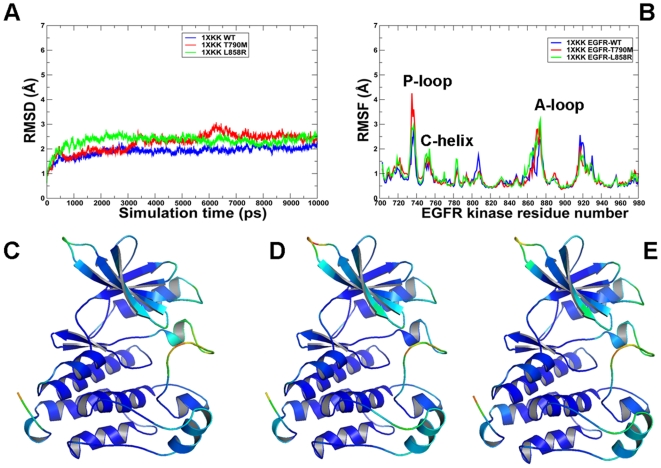
Figure 6. MD simulations of the EGFR kinase domain in the Src/Cdk-like inactive form.
Upper Panel: (A) The RMSD fluctuations of Cα atoms and (B) the RMSF values of Cα atoms from MD simulations of EGFR-WT (in blue), EGFR-T790M (in red), and EGFR-L858R (in green). MD simulations were performed using the Src/Cdk-like inactive form of the EGFR kinase domain. Legends inside the figure panels refer to the pdb entries used in MD simulations. Lower panel: Color-coded mapping of the averaged protein flexibility profiles (RMSF values) from MD simulations of the EGFR-WT and EGFR mutants. This mapping is presented for EGFR-WT (C), EGFR-T790M (D) and EGFR-L858R (E). The color-coded sliding scheme is the same as was adopted for Figure 3.

