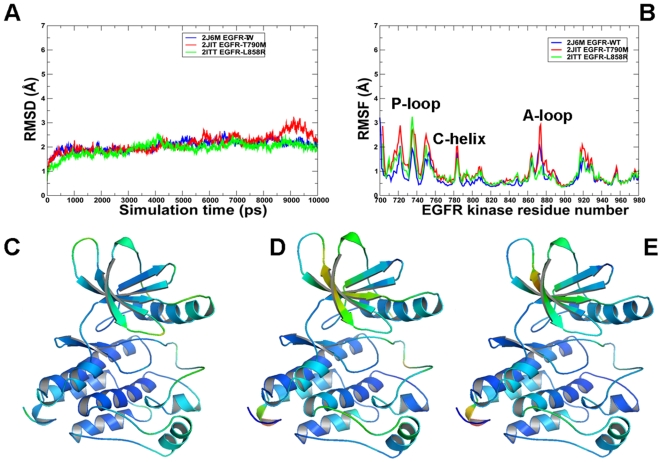
Figure 7. MD simulations of the EGFR kinase domain in the active form.
Upper Panel: (A) The RMSD fluctuations of Cα atoms and (B) the RMSF values of Cα atoms from MD simulations of EGFR-WT (in blue), EGFR-T790M (in red), and EGFR-L858R (in green). MD simulations were performed using the active form of the EGFR kinase domain. Legends inside the figure panels refer to the pdb entries used in MD simulations. Lower Panel: Color-coded mapping of the averaged protein flexibility profiles (RMSF values) from MD simulations of the EGFR-WT and EGFR mutants. This mapping is presented for EGFR-WT (C), EGFR-T790M (D) and EGFR-L858R (E). The color-coded sliding scheme is the same as was adopted for Figure 3.

