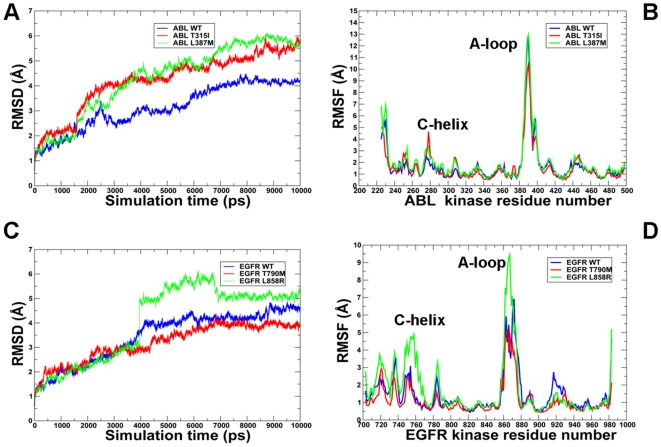
Figure 11. TMD simulations of the ABL and EGFR kinase domains.
Time-dependent RMSD profile of Cα atoms obtained from TMD simulations of ABL (A) and EGFR kinase domains (C). The RMSF values of Cα atoms obtained from TMD simulations of ABL (B) and EGFR kinase domains (D). ABL-WT/EGFR-WT (in blue), ABL-T315I/EGFR-T790M (in red), and ABL-L387M/EGFR-L858R (in green). Legends inside the figure panels refer to the pdb entries corresponding to MD simulations from different conformational states of the kinase domain.

