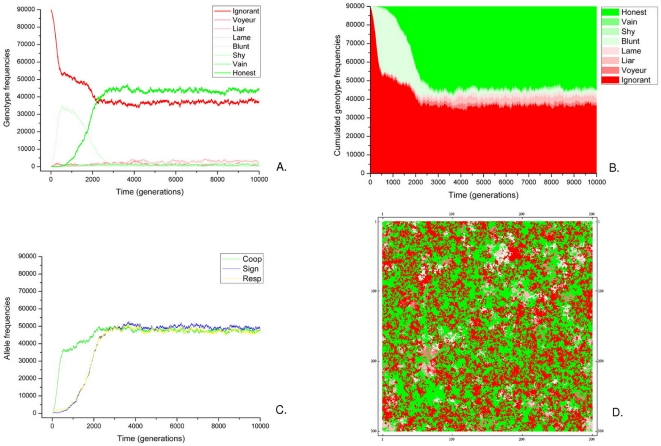
Figure 2. Details of a single QS-enabled simulation.
Parameters as in Fig. 1, except for μs = μr = 10−4; mc = 30.0, ne = 3 and D = 0.0. Time evolution of A.: genotype frequencies; B.: genotype distribution; C.: allele frequencies. D.: The spatial pattern of genotypes at T = 10.000.

