
Figure 5.
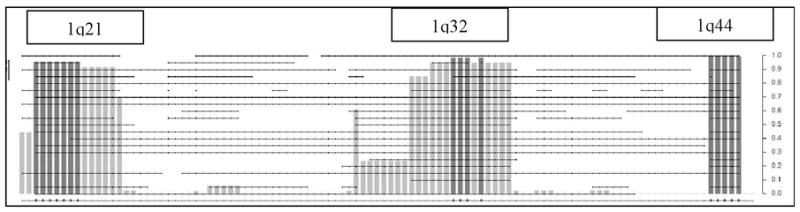
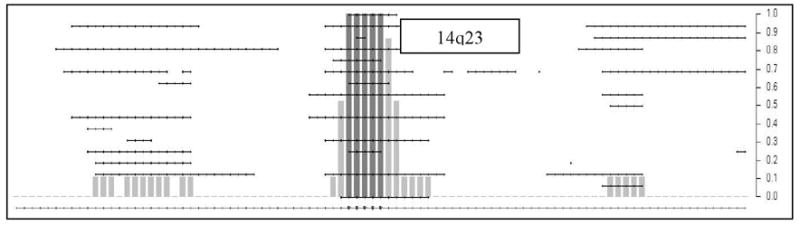
Figure 5A and 5B. This figure represents the expanded STAC output for chromosomes 1 and 14. The dotted horizontal lines indicate individual tumor profiles. The X-axis included the footprint (fp)-values and Y-axis includes the frequency (f) values.