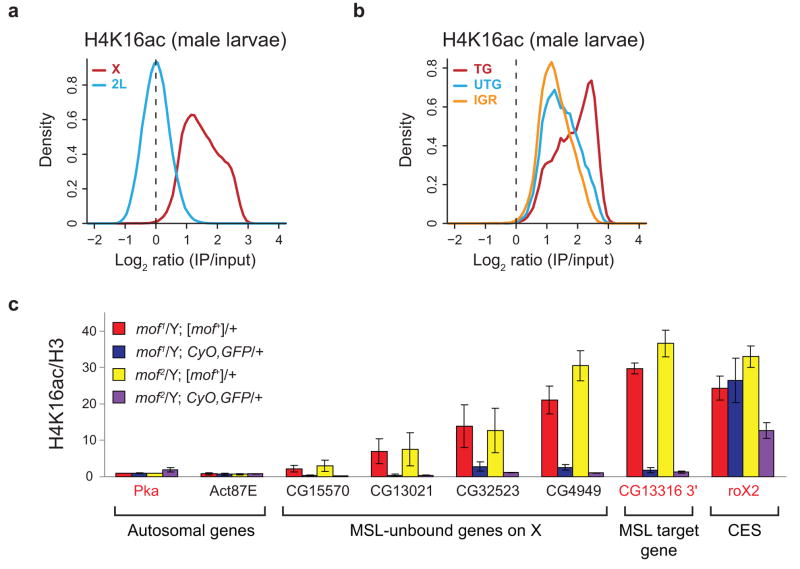
Figure 4.
Global H4K16ac on the male X in vivo. (a) H4K16ac is enriched along the majority of the X chromosome relative to 2L in male larvae. The distribution of log ratios at all probes on the X (red) and 2L (blue) is plotted for H4K16ac in male larvae. (b) As in SL2 cells, transcribed genes show the highest levels of H4K16ac in male larvae. The distribution of log ratios at all probes on the X chromosome, classified according to probes present in transcribed genes (TG, red), untranscribed genes (UTG, blue) and intergenic regions (IGR, orange), is shown. (c) MOF is required for H4K16ac in male larvae at sites on the X that lack detectable MSL3-TAP binding, as determined by ChIP-chip11. mof mutant male larvae (blue, purple) and their wild-type brothers (red, yellow) were generated from mof+ mothers. Known MSL targets (the roX2 CES (chromatin entry site) and CG13316 3′ end) and autosomal genes served as positive and negative controls, respectively. We assayed four genes on the X that lack detectable MSL binding11 but are enriched by H4K16ac in male larval ChIP-chip experiments (CG15570, CG13021, CG32523 and CG4949). Genes were classified as transcribed (gene names in red) or untranscribed (gene names in black) based on Affymetrix analysis in SL2 cells5. The H4K16ac ChIP signals were quantified as percent IP normalized to input and H3 levels. The ChIP signals for the two mof1 and the two mof2 genotypes were then normalized to Pka from mof1/Y; [mof+]/+ and mof2/Y; [mof+]/+ males respectively, and the replicates were averaged (see Supplementary Methods). The error bars represent the range from two independent experiments.

