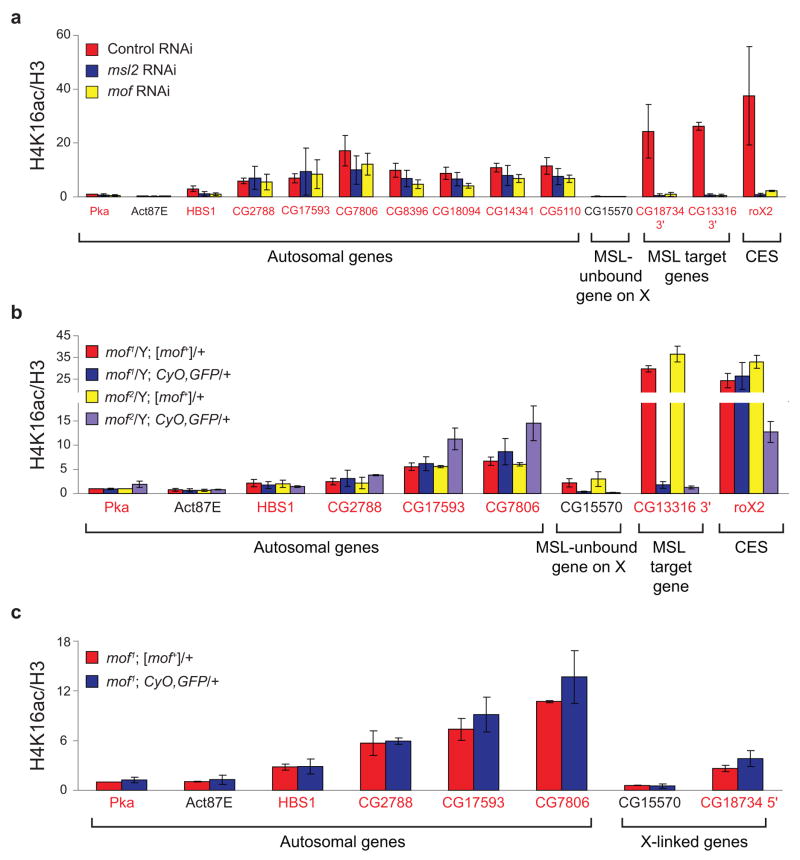
Figure 6.
Limited role for MOF in 5′ H4K16ac. The 3′ ends of known MSL target genes and the roX2 CES (chromatin entry site) served as positive controls in SL2 cells and male larvae. Primers were designed in the 5′ ends of seven active genes on chromosome 2L that exhibited 5′-biased H4K16ac enrichment in ChIP-chip experiments. The HBS1 (chromosome 3L) P2 primer set was utilized to examine 5′ H4K16ac in a previous study33. Genes were classified as transcribed (gene names in red) or untranscribed (gene names in black) based on Affymetrix analysis in SL2 cells5. (a) MOF is not solely responsible for H4K16ac at the 5′ ends of autosomal genes in SL2 cells. RNAi was performed in SL2 cells for the negative GFP control (red), msl2 (blue) or mof (yellow). Average H4K16ac ChIP signal is quantified as in Figure 3a. (b) MOF is not required for H4K16ac at the 5′ ends of autosomal genes in male larvae. The average H4K16ac ChIP signals from mof mutant male larvae (blue, purple) and their wild-type brothers (red, yellow) are quantified as in Figure 4c. (c) MOF is not required for H4K16ac at the 5′ ends of genes on X or autosomes in female larvae. The H4K16ac ChIP signals from mof1 mutant females (blue) and their wild-type sisters (red) are presented as percent IP normalized to input and H3 levels. The ChIP signals were normalized to Pka from mof1; [mof+]/+ females before averaging the replicates (see Supplementary Methods). Error bars represent the range from two independent experiments.

