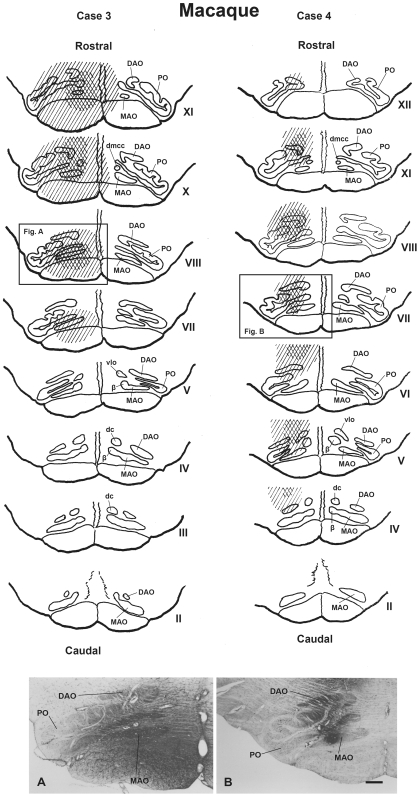
Figure 4. WGA-HRP injection sites in macaque's inferior olivary complex (case 3 and 4).
The upper two columns comprise a scale drawing of the distribution of injected WGA-HRP solution in the macaque's inferior olivary complex in case 3 and 4. The Roman numerals (II–XII) represent levels of the inferior olivary complex from caudal to rostral (Brodal and Brodal, 1981 [61]). The crossed stripes indicate a heavily stained area. Lower photomicrographs show the maximal extent of injected WGA-HRP at the olivary level in case 3 (Fig. A) and case 4 (Fig. B). DAO–dorsal accessory olive, dc–dorsal cap, dmcc–dorsomedial cell column, MAO–medial accessory olive, PO–principal olive, vlo–ventrolateral outgrowth, β–nucleus β. Scale bar = 500 µm in B (also applies to A).

