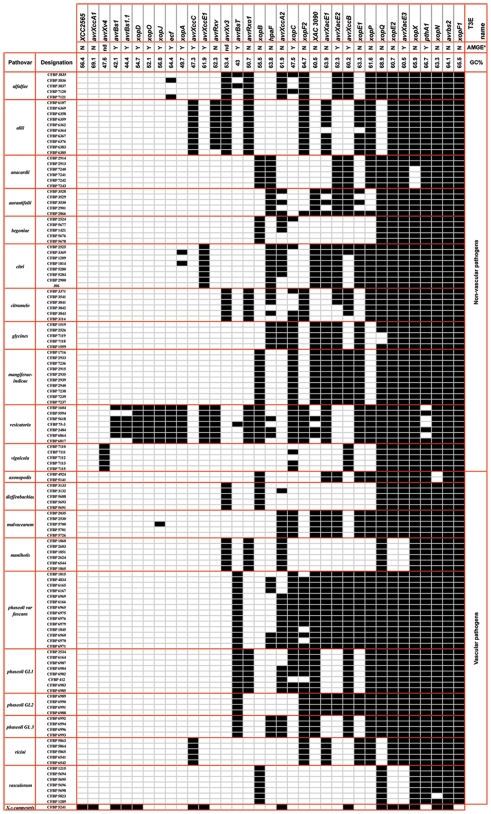
Figure 2. Distribution of T3E genes among strains belonging to 18 pathovars of Xanthomonas axonopodis.
In this figure, the presence or the absence of an ortholog of each selected T3E gene was determined by dot-blot hybridizations. Black squares represent presence of the corresponding gene, whereas white squares represent absence of sequence similar to the probe used. In the latter case, gene may be absent or its sequence is too divergent to be detected. The GC% of each T3E gene is indicated on the basis of sequences of the orthologs found in the databases. *AMGE indicates whether the considered gene was reported to be Associated to Mobile Genetic Elements in Xanthomonas strains whose genome was sequenced (Y:Yes; N: No) [8], [64].

