
Figure 2.
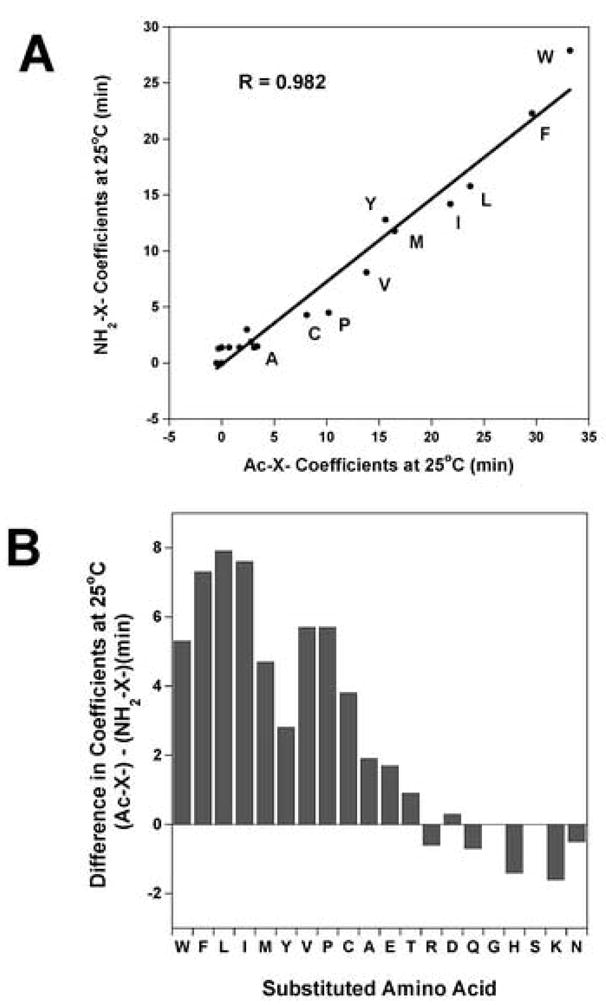
Panel A: Correlation plot of the hydrophilicity/hydrophobicity coefficients at the peptide N-terminus when the end group is Nα-amino versus Nα-acetyl. The coefficients were determined from reversed-phase retention behaviour of peptides at 25°C (data taken from Peptide 3 and Peptide 4, Table 3). The peptide sequences are shown in Table 1. The hydrophobic amino acid substitutions are denoted by the single letter code. Y = 0.739 x + 0.114, correlation coefficient R = 0.982. Panel B: The difference in coefficients between Peptide 3 and Peptide 4 are plotted as a bar graph (data taken from Table 3).