
Figure 6.
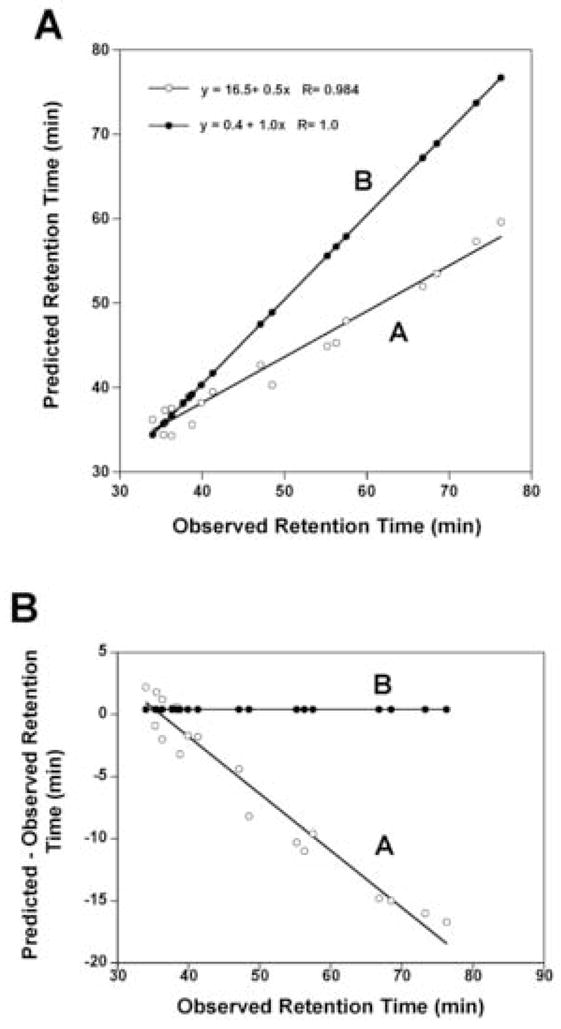
Panel A: Correlation plots of predicted retention times versus observed retention times for the data shown in Table 4 for columns 8 and 10. Plot A uses the experimentally derived internal coefficients for all residues in the sequence and Plot B uses the internal coefficients for all residues except the C-terminal residue which uses the C-terminal X-carboxyl coefficients. Panel B: Correlation plots of the difference between predicted and observed versus observed retention times. Plots A and B use predicted values determined as described in Panel A.