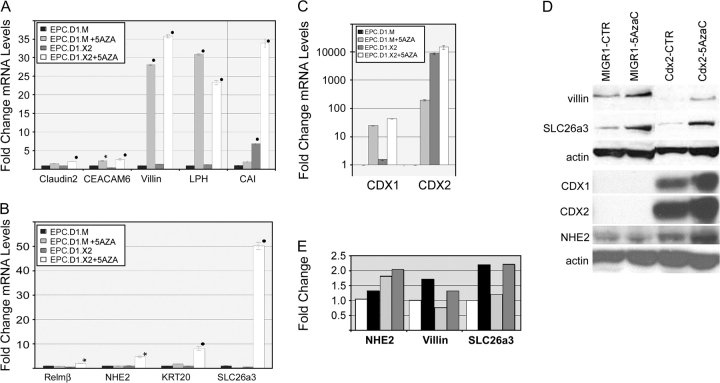
Fig. 4.
Cdx2 expression alone has minimal effects on EPC-hTERT intestinal transdifferentiation. (A and B) Quantitative SYBR-green RT–PCR analysis of gene expression in EPC-hTERT.D1-MIGR1 (EPC.D1.M) or EPC-hTERT.D1-Cdx2 (EPC.D1.X2) cells treated for 5 days with 5 μM of 5-azacytidine (5AZA) or diluent control (CTR). Genes tested included Claudin2, CEACAM6, Villin, LPH, CAI, RELM-β, NHE2, KRT20 and DRA/SLC26A3. The PCR control was the phosphoprotein 36B4. ΔCt values were calculated after duplicate PCRs for each sample, then statistical analysis was performed (analysis of variance and Tukey Rank Mean). ΔΔCt values were then calculated and used to determine fold change in expression (n = 6 samples). Black circle = significantly differs from MIGR-diluent control, P < 0.0005; black star = significantly differs from MIGR-diluent control, P < 0.005. (C) Quantitative SYBR-green RT–PCR analysis of CDX1 and CDX2 gene expression in EPC-hTERT.D1.MIGR1 (EPC.D1.M) or EPC-hTERT.D1.Cdx2 (EPC.D1.X2) cells treated with 5 μM 5-azacytidine (5AzaC) or diluent control. PCR controls and the calculation of average ΔΔCt values (and standard deviations) were carried out as before (n = 3). (D) Western blot for CDX1, CDX2, DRA/SLC26a3, villin and NHE2 protein levels in EPC-hTERT.D1.MIGR (MIGR1) or EPC-hTERT.D1.Cdx2 cells (CDX2). Cells were treated with 5 μM 5-azacytidine (5AzaC) or diluent control. The blots were routinely stripped and reprobed for actin levels as loading control. One of three experiments is shown. (E) Quantitative densitometry measurements of selected western band densities. Values were normalized to actin bands, then expressed as fold change compared with EPC-hTERT.D1.MIGR cells treated with diluent (white bars). Black bars, EPC-hTERT.D1.MIGR cells treated with 5 μM 5-azacytidine. Light gray bars, EPC-hTERT.D1.Cdx2 cells with diluent. Dark gray bars, EPC-hTERT.D1.Cdx2 cells with 5 μM 5-azacytidine.

