
Fig. 6.
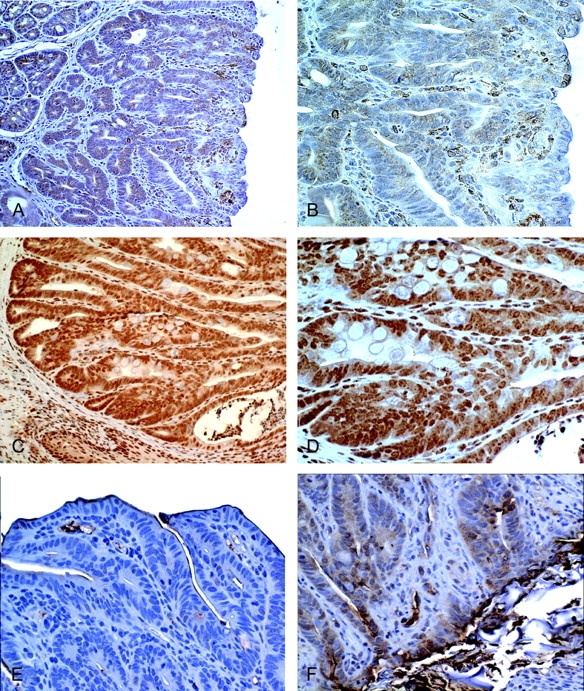
Expression levels of Cox-2 and iNOS are increased in tumors from Hsp70 KO mice. AOM/DSS-induced tumors from WT and Hsp70−/− mice were stained for Cox-2 and iNOS. (A) Cox-2 in tumor from WT mouse, ×200. (B) Cox-2 in tumor from WT mouse, ×400. (C) Cox-2 in tumor from Hsp70−/− mouse, ×200. (D) Cox-2 in tumor from Hsp70−/− mouse, ×400. (E) iNOS in tumor from WT mouse ×400. (F) iNOS in tumor from Hsp70−/− mouse, ×400. Note that increased epithelial and stromal Cox-2 and epithelial iNOS staining in tumors from Hsp70−/− mice compared with Hsp70 WT mice. Shown are representative tumors from three mice in each group.