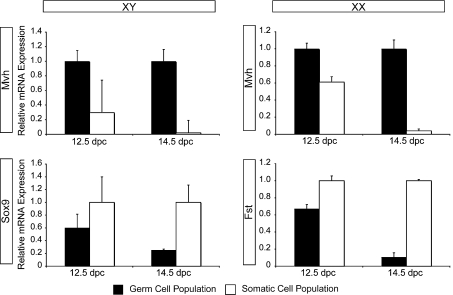
Figure 1. Analysis of XY and XX isolated germ cell population purities.
12.5 and 14.5 dpc germ cell populations were assessed for gene expression of the germ cell marker Mvh, and the somatic cell markers Sox9 (XY) and Fst (XX). qPCR analysis from purified populations normalized to 18S RNA. n=3, error bars represent S.E.M. Highest expression of Mvh was detected in all germ cell populations. Expression of Sox9 was highest in the XY somatic cell populations, with greatest specificity at 14.5 dpc. Expression of Fst was also highest in the XX somatic cell populations, with greatest specificity at 14.5 dpc.

