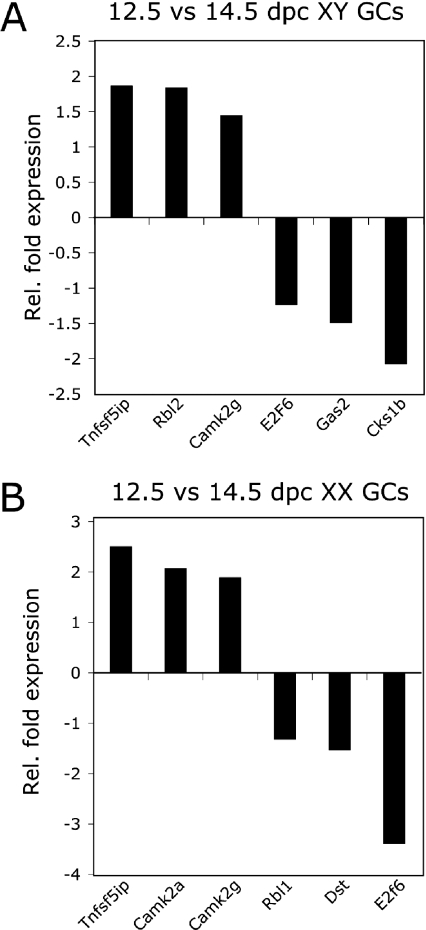
Figure 3. Validation of significantly up- and down-regulated transcripts identified from 12.5 versus 14.5 dpc germ cell populations.
qPCR analysis from purified populations normalized to 18S RNA, n=3. (A) Increased fold expression of Tnfs5ip, Rbl2 and Camk2g and decreased fold expression of E2f6, Gas2 and Cks1b in XY 14.5 dpc populations relative to XY 12.5 dpc populations. (B) Increased fold expression of Tnfs5ip, Camk2a and Camk2g and decreased fold expression of Rbl1, Dst and E2f6 in XX 14.5 dpc populations relative to XX 12.5 dpc populations. Gc, germ cell; Rel., relative.

