Figure 10.
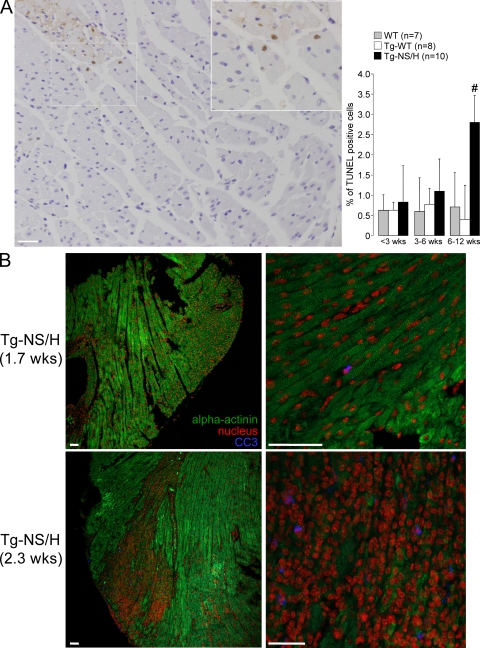
Cardiomyocyte apoptosis in Tg-NS/H mice. (A, left) TUNEL analysis of cardiac apoptosis. Note the presence of positive-stained myocyte nuclei (brown) close to an area of myocyte necrosis. (inset) Close-up of boxed area. Bar, 50 µm. (right) Mean values are depicted for the percentage of TUNEL-positive cells in three age groups. Data in this figure are representative of 7 WT, 8 Tg-WT, and 10 Tg-NS/H mice. #, P < 0.05 vs. WT and Tg-WT. (B) Immunohistochemical analysis of cleaved caspase-3 (CC3) for assessment of apoptosis in cardiac cryosections from Tg-NS mice. In Tg-NS mice <2 wk old (1.7 wk old in this example), cardiac structure was still unaltered, as indicated by the normal α-actinin staining pattern, and CC3-positive cells were hardly observed. In contrast, in hearts of Tg-NS mice of >2 wk old, clear CC3 staining was observed, but only in necrotic areas of the ventricular myocardium. Bars, 50 µm.

