Figure 4.
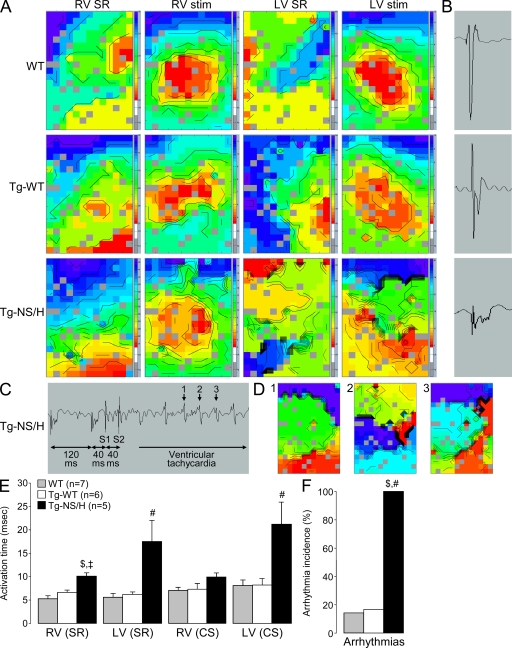
Epicardial mapping experiments in Langendorff-perfused hearts. (A) Examples of RV and LV activation maps for WT, Tg-WT, and Tg-NS/H hearts during sinus rhythm (SR) and stimulation from the center of the electrode (stim). Crowding of isochrones in Tg-NS/H hearts indicates areas of conduction slowing. (B) Examples of extracellular electrograms showing fractionation of the extracellular signal (a sign of excessive conduction slowing) in Tg-NS/H but not in WT or Tg-WT mice. (C) Induction of VT in a Tg-NS/H heart after administration of two short-coupled extrastimuli (S1 and S2). (D) Ventricular activation map during beats 1–3 of the VT depicted in C. (E) Mean RV and LV activation times during SR and central stimulation (CS). (F) Mean incidence of inducible arrhythmias. Data represent means ± SEM from single independent epicardial mapping experiments from five WT, six Tg-WT, and five Tg-NS/H mice (#, P < 0.05 vs. WT; ‡, P < 0.01 vs. WT; $, P < 0.05 vs. Tg-WT; Table S4).

