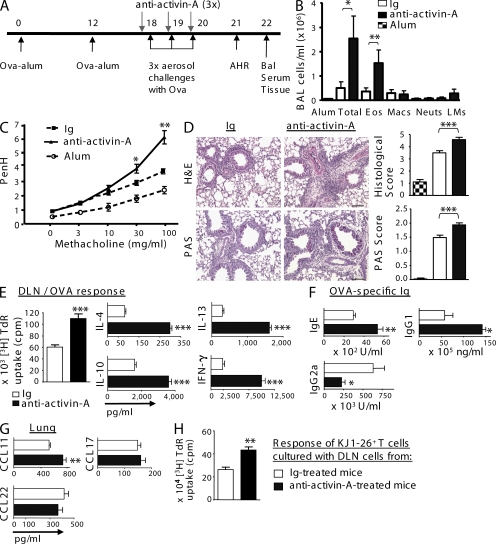
Figure 1.
In vivo depletion of activin-A during pulmonary allergen challenge exacerbates allergic airway disease and Th2 responses. (A) Experimental protocol used to block endogenous activin-A during pulmonary challenge. (B) BAL differentials from mice treated with anti–activin-A or Ig control, or from the alum controls are expressed as means ± SEM (n = 5–8 mice per group in four separate experiments). Statistical significance was obtained by an unpaired Student's t test (*, P = 0.0345; **, P = 0.0476). (C) AHR is depicted. Results shown for PenH are expressed as means ± SEM (n = 5–8 mice per group in four separate experiments). Data were analyzed by two-way analysis of variance (ANOVA) for repeated measures, followed by an unpaired Student's t test (*, P = 0.0164; **, P = 0.00047). (D) Representative photomicrographs demonstrating lung inflammation (H&E-stained sections) and mucus secretion (PAS-stained sections). Histological scores of H&E-stained (***, P = 0.0009) and PAS-stained (***, P < 0.0001) sections. Error bars depict means of groups (n = 5–8 mice per group in four independent experiments). Bars, 100 µm. (E) DLN cells were restimulated ex vivo with OVA. Proliferation was measured by [3H]thymidine incorporation. Results are shown as means ± SEM of triplicate wells (n = 5–8 mice per group in four independent experiments; ***, P < 0.0001). IL-4 (***, P < 0.0001), IL-13 (***, P < 0.0001), IL-10 (***, P < 0.0001), and IFN-γ (***, P < 0.0001) in supernatants are shown. Results are means ± SEM of duplicate wells (n = 5–8 mice per group in four independent experiments). (F) OVA-specific IgE (**, P = 0.0060), IgG1 (*, P = 0.0165), and IgG2a (*, P = 0.0218) in the sera of mice. Results are means ± SEM (n = 5–8 mice per group in four independent experiments). (G) CCL11 (**, P = 0.0054), CCL17 (P = 0.9399), and CCL22 (P = 0.5000) in lung homogenates are shown. Results are means ± SEM (n = 5–8 mice per group in four separate experiments). (H) DLN cells from anti–activin-A– or Ig–treated mice were co-cultured with LN KJ1-26+CD4+ T cells (2:1) in the presence of OVA323-339 peptide, and proliferation was measured (**, P = 0.001). The results are means ± SEM (n = 5–8 mice per group in two independent experiments). Eos, eosinophils; LMs, lymphomononuclears; Macs, macrophages; Neuts, neutrophils.

