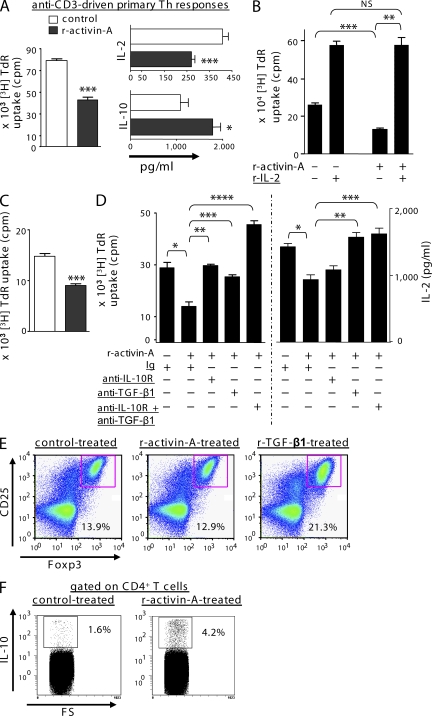
Figure 4.
Activin-A–induced suppression is partly dependent on IL-10 and TGF-β1. (A) CD4+ T cells were stimulated with anti-CD3 and irradiated APCs as indicated. Proliferation was measured. The results are means ± SEM of triplicate wells from at least three separate experiments. Statistical significance was obtained by an unpaired Student's t test (***, P = 0.0009). IL-2 (***, P = 0.0004) and IL-10 (*, P = 0.0463) in supernatants are shown. (B) Proliferation of CD4+ T cells stimulated as in A in the presence of r-activin-A and rIL-2 as indicated (***, P < 0.0001; **, P = 0.0010; P = 0.9871). The results are means ± SEM of triplicate wells from three separate experiments. (C) DLN cells, obtained from OVA/CFA-immunized BALB/c mice, were stimulated ex vivo with OVA as indicated. Proliferation was measured (***, P < 0.0001). The results are means ± SEM of triplicate wells from three independent experiments. (D) Proliferation of CD4+ T cells stimulated with anti-CD3 and irradiated APCs with PBS or r-activin-A, as indicated (*, P = 0.0054; **, P = 0.0011; ***, P = 0.0012; ****, P = 0.0002). IL-2 (*, P = 0.0005; **, P = 0.0004; ***, P = 0.0003) in supernatants is shown. The results are means ± SEM from two separate experiments. (E) Stimulated (anti-CD3/CD28 with rIL-2) CD4+ T cells from PBS-, r-activin-A–, or TGF-β1–treated cultures were stained and analyzed by flow cytometry. Numbers indicate percentages of CD4+ gated cells positive for CD25 and Foxp3. Values are expressed as means ± SEM from two separate experiments. (F) CD4+ T cells, stimulated as in A, stained with antibodies to CD3, CD4, and IL-10. Representative dot plots showing CD4+IL-10+ cells from cultures of PBS- or r-activin-A–treated cells. Numbers above boxed areas indicate the percentage of DLN cells in the outlined gate. Values are expressed as means ± SEM from two separate experiments. FS, forward scatter.

